Work with Timespan Symbology
A timespan is a feature on the timeline that represents temporal data that includes a start and end field. It is used to symbolize an event that takes course over a period of time instead of a single point in time. Using Timespan Symbology a user can symbolize timespans to help differentiate features on a timeline.
Note:
Standalone tables are not supported for symbology.
Symbolize the timespan
To symbolize the timespan, do the following:
Create or open a Timeline.
In the Contents pane, select a layer on the Timeline.
On the Timeline tab, in the Symbology group, click Symbology.
The Symbology pane opens.
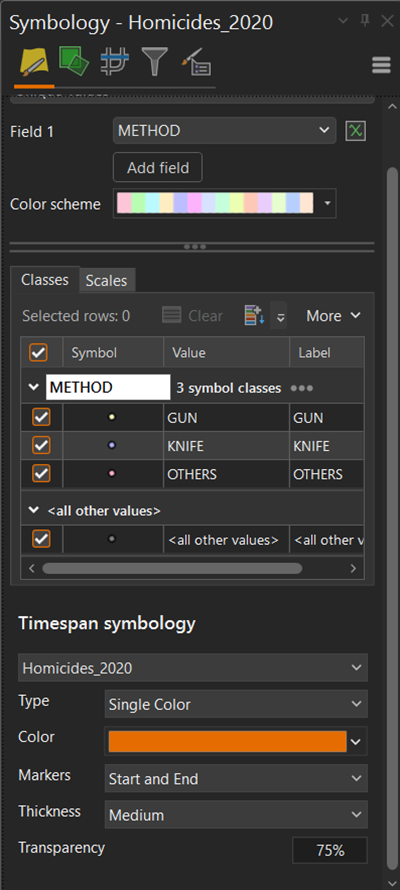
In the Type drop-down menu, select either Single Color or Alternating Color.
Click the Color Scheme drop-down menu.
The ArcGIS Colors pallette opens.
In the ArcGIS Colors pallete select a color.
In the Markers drop-down menu, select a temporal boundary to visualize.
In the Thickness drop-down menu, select a thickness type.
In the Transparency text box, type a digit for the transparency of the timespan.