ArcGIS Living Atlas reference
ArcGIS Living Atlas is a collection of web maps and layers created by GIS and industry professionals. This collection provides global, geographically based data in a ready-to-use ArcGIS format. You can use ArcGIS Living Atlas content in your ArcGIS Business Analyst Web App projects as geographic features or variables.
Applications of ArcGIS Living Atlas content in ArcGIS Business Analyst Web App are shown in the following image. Blue color coding indicates a Standard license capability; green color coding indicates an Advanced license capability.
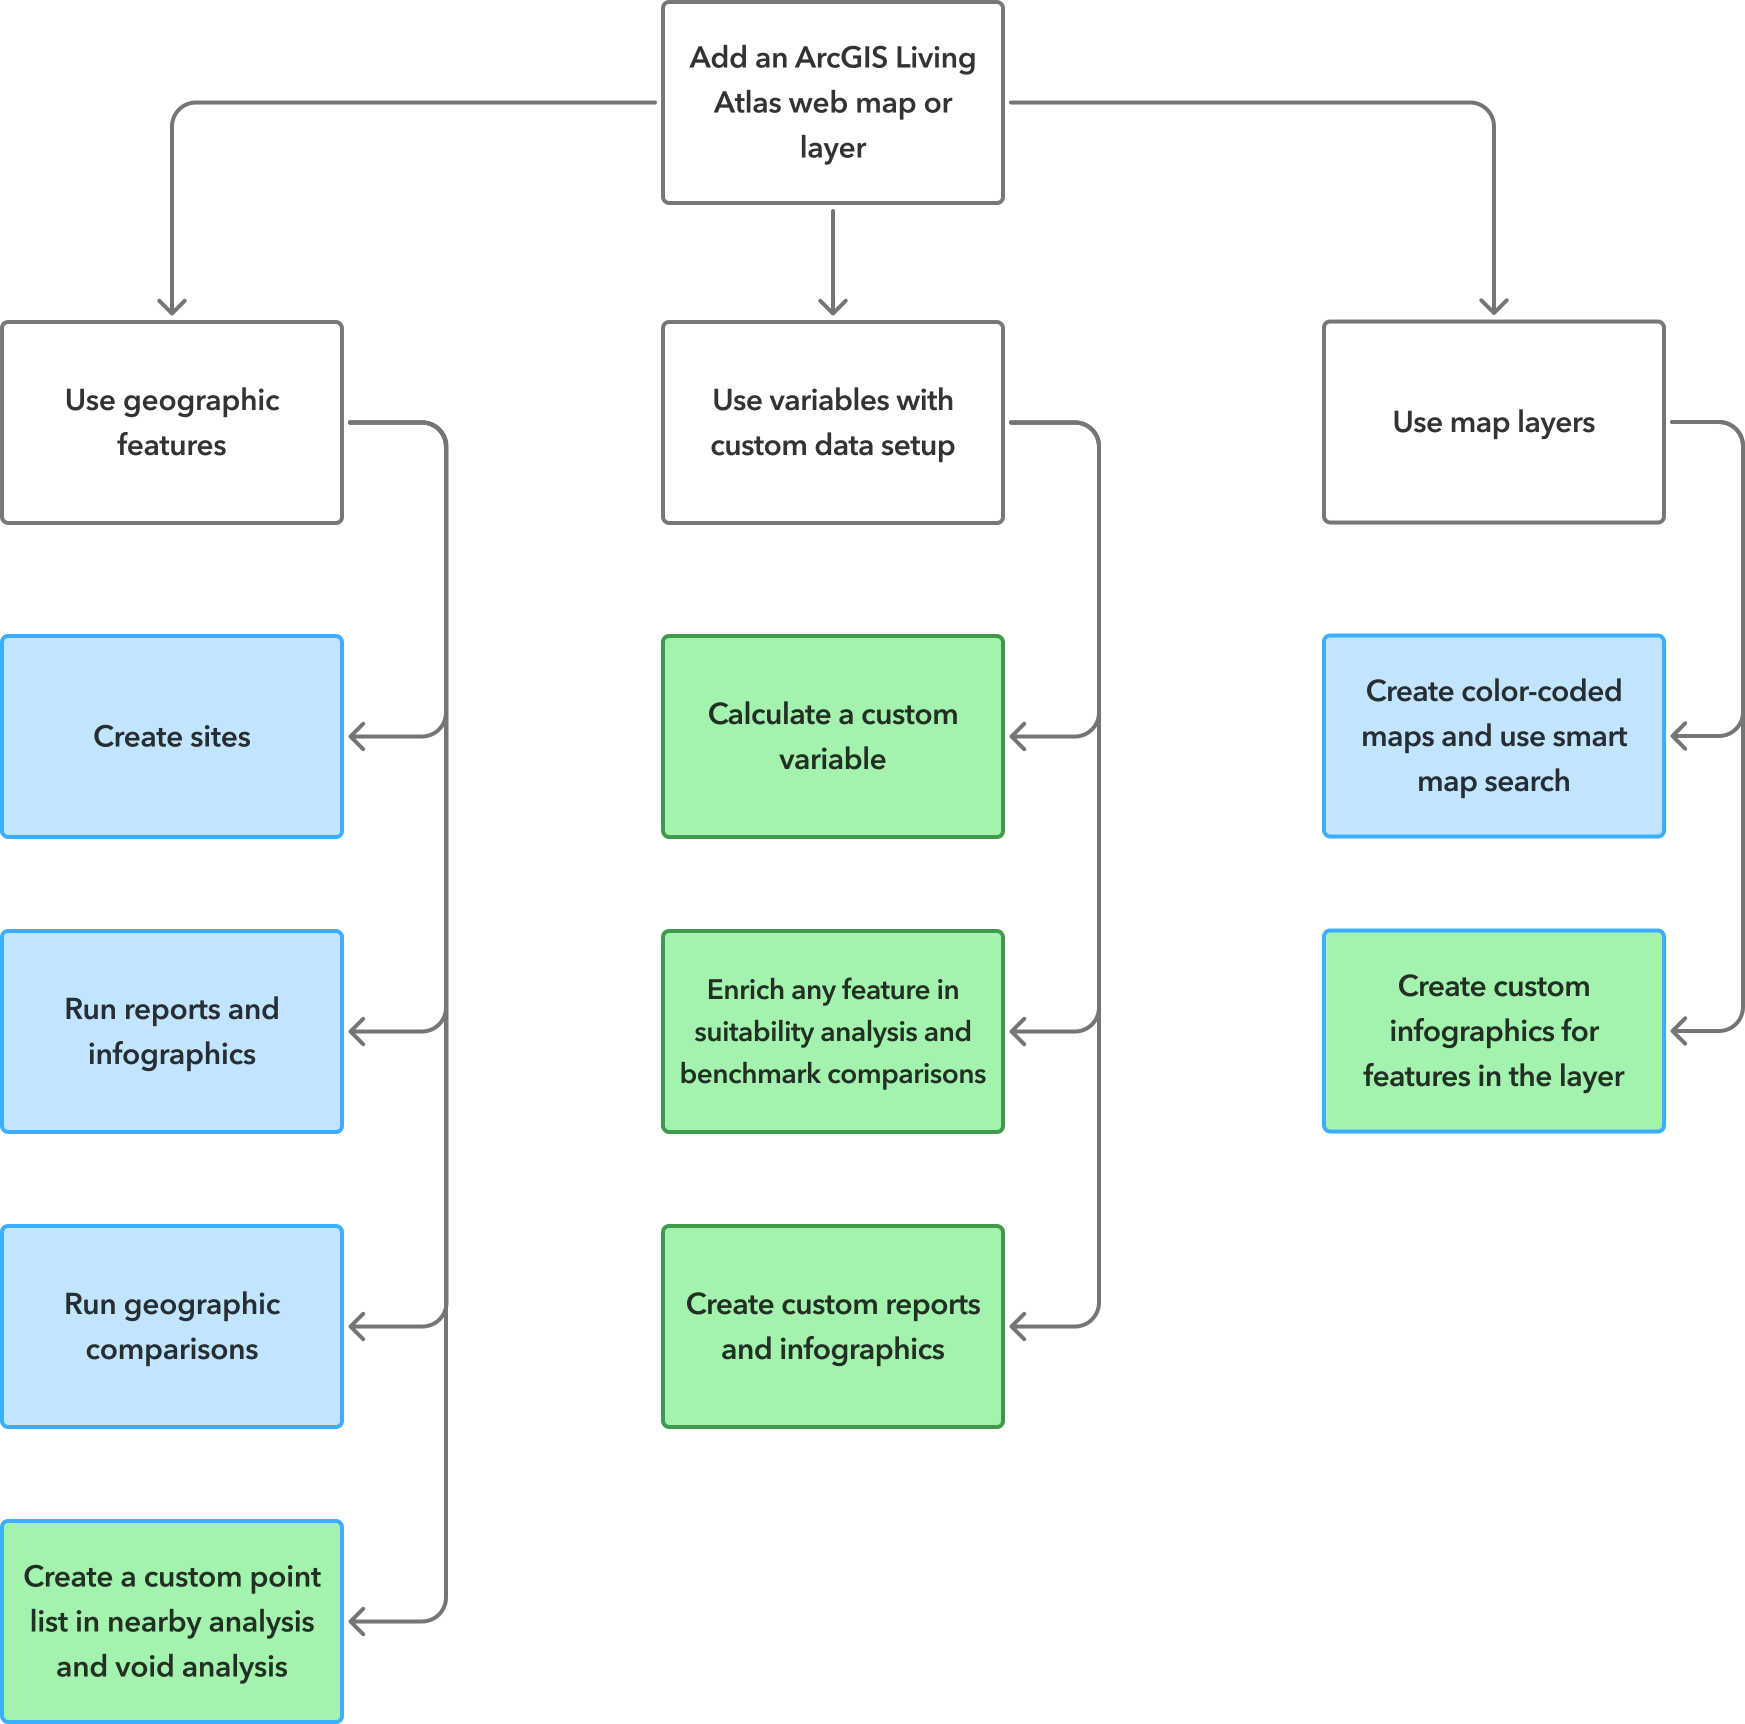
To access ArcGIS Living Atlas content in Business Analyst Web App, use the add web maps and layers workflow.
Potential use cases
The following are potential use cases for using ArcGIS Living Atlas content in Business Analyst Web App for mapping and analysis:
|
Application |
Description |
Examples of data and analysis used |
|---|---|---|
|
Evaluate transit stops within your site areas. |
Add a web map of world transit stops. Use this layer in the nearby analysis workflow as a web layer point list to evaluate how many transit stops are within your site areas. |
The World Transit Stops (web map) is used as geographic features to create a custom point list in a nearby analysis. |
|
Rank agricultural sites by workforce development potential. |
Add a web map of USDA agriculture mapping all American farms and ranches. With the features on the map, perform a suitability analysis using the features as sites. You can rank each site by workforce development variables to assess future growth. |
The USDA Census of Agriculture (web map) is used as geographic features to create sites for suitability analysis. |
|
Research areas to prioritize broadband expansion. |
Add a web map of broadband coverage. Use a variable to create a color-coded map visualizing the least served population by broadband to evaluate high priority areas. |
The FCC Broadband Data Collection (web map) is used as map layer variables to create a color-coded map. |
|
Map flood risk to essential services. |
Add a web map of flood hazard areas. Perform a points of interest (POI) search for essential services, such as grocery stores and pharmacies, overlaid on the web map. You can visually confirm which essential services overlap directly with high-risk flood zones to create disaster response and mitigation decisions. |
The USA Flood Hazard Areas (web map) is used as geographic features for visual comparison with POIs. |
ArcGIS Living Atlas content as geographic features
You can use ArcGIS Living Atlas geographic features in your Business Analyst Web App projects as sites or points.
Note:
The ArcGIS Living Atlas geographic features usable in Business Analyst Web App includes polygons, standard geographies, and points. Other types of ArcGIS Living Atlas geographic features, such as raster data and imagery, are not currently available.
There are a few ways to create sites using your ArcGIS Living Atlas features. Sites can be used as an area of interest in color-coded maps, suitability analysis, and more. Add a web map to your project and do any of the following:
Click a feature on the map, and click Create site. For points, you must create buffers (such as rings, walk times, or drive times) to define the site area.
In suitability analysis or benchmark comparisons, click Features on the map. Select the features you want to turn into sites, and click Next to continue the workflow.
Open the project pane, and use the set up a layer workflow to create sites for your active session that are not saved to the project.
In addition to creating sites, you can use points in nearby analysis and void analysis as follows:
In nearby analysis, select points from a web layer. This option integrates your ArcGIS Living Atlas point layers into the nearby analysis workflow so that you can analyze the number of points within your site areas.
In void analysis, create a custom point list using a custom layer. This option adds a custom point layer to your void analysis so that you can analyze points within your analysis and reference areas.
ArcGIS Living Atlas content as variables
You can use ArcGIS Living Atlas content in your Business Analyst Web App projects as variables from map layers and custom data.
Map layers
When the ArcGIS Living Atlas map layer is displayed, you can use map layer variables to create color-coded maps and use smart map search.
To access ArcGIS Living Atlas content as map layer variables, open the color-coded maps or smart map search workflows, and click Browse all variables. In the data browser, click My variables or Other variables to browse variables from the map layer.
Not all features in a layer may be visible at the current map extent, so you may need to zoom in or zoom out of the map. Zooming in on the map provides greater specificity in the map with less features and more detail. In contrast, zooming out on the map provides a broader area of analysis with more features and less detail.
Note:
You can use up to two variables in color-coded maps and up to ten variables in smart map search.
Custom data
You can set up ArcGIS Living Atlas variables as custom data to perform complex analysis, such as suitability analysis, benchmark comparisons, and custom infographics. Custom data set up uses ArcGIS GeoEnrichment Service to add data to a map in the area you specify so that you can generate actionable information.
To get started, set up an existing ArcGIS layer as custom data. In the custom data set up workflow, choose the Browse for a layer option, and expand the Living Atlas content. Once you've selected a layer, configure the variables it contains.
You can use these custom data variables across several workflows, including the following:
Enrich any feature in suitability analysis and benchmark comparisons.
Create custom reports and infographics.
Calculate a custom variable.
Best practices for browsing ArcGIS Living Atlas content
The curated collection of ArcGIS Living Atlas content in Business Analyst Web App is searchable and filterable. Items in the Web maps and layers window have icons to indicate whether they contain data that can be used as geographic features or variables as follows:
The Web map layer indicator
 signifies that the item contains features that you can convert into sites.
The Web map containing variables indicator
 signifies that the item contains variables that you can use to create maps using the color-coded maps and smart map search workflows.
To view a more curated collection of ArcGIS Living Atlas web maps, expand the Featured category, and show all the results. Many items are available on standard census geographies (from state down to block group), and updates follow each source's cadence. For insight into the underlying data, click Data  to view a summary of the data categories included in that web map or layer.
Limitations
Users are responsible for adhering to the terms of use for each item of ArcGIS Living Atlas content in Business Analyst Web App. Terms of use include limitations on sharing web maps and modifying its contents. See the Esri Master Agreement, Products and Services (E204) for full definitions, terms, and conditions.
To view each item's terms of use, do the following:
In Business Analyst Web App, on the Maps tab, click Add data, and choose Web maps and layers.
Expand the Living Atlas section in the Web maps and layers window.
Click the Options button
 for an item, and click Open details pane.
Click View item details page.
On the item details page, read the Terms of Use section.
Credits
If you create sites with buffers from web map features, credits are consumed. To learn more about credit consumption, see Credits.
Licensing requirements
You can add ArcGIS Living Atlas web maps and layers to a Business Analyst Web App project with a Standard or Advanced license. To set up ArcGIS Living Atlas variables as custom data, you must have an Advanced license.
To learn more about Business Analyst license types, see Licenses.
Resources
To learn more about using ArcGIS Living Atlas content in Business Analyst Web App projects, see the following resources: