Esri Dependency Ratios methodology
Esri creates Dependency Ratios data as part of the Updated Demographics dataset for the United States. This topic describes the methodology used to create that data.
Tip:
Esri also provides a copy of this topic as a technical paper: 2026/2031 Esri Dependency Ratios (PDF).
About Esri Dependency Ratios
The concept of dependency is critical to understanding a population as its age structure and labor force conditions shift. High levels of dependency can indicate an imbalance and a potential need for additional resources to accommodate the large proportion of dependents. To provide a more complete view of dependency, Esri produces two sets of ratios: Age Dependency Ratios and Economic Dependency Ratios.
Age Dependency Ratios
The Age Dependency Ratio (ADR) is a measure of the nonworking-age population relative to the population of working age and serves as a useful indicator of an area's age structure. This measure is used to express the relationship between three age groups in a population: under 18, 18 to 64, and 65 and older. Dependent populations are defined as children under age 18 and seniors aged 65 and older. For this measure, the population aged 18 to 64 is considered the working-age population.
Three separate Age Dependency Ratios are calculated:
The Child Dependency Ratio (CDR) is the population under 18 years of age divided by the working-age population aged 18 to 64.
The Senior Dependency Ratio (SDR) is the population aged 65 and older divided by the working-age population aged 18 to 64.
The ADR is calculated as the sum of the population under 18 years of age and 65 and older divided by the working-age population aged 18 to 64.
All ratios are then multiplied by 100.
Higher ratios indicate a greater level of dependency on the working-age population. The U.S. ADR is 65.8 for 2026—or 65.8 dependents for every 100 individuals aged 18 to 64. Correspondingly, the U.S. CDR and SDR are 34.3 and 31.5, respectively. This reveals that children represent a larger share of the dependent population than seniors at the national level.
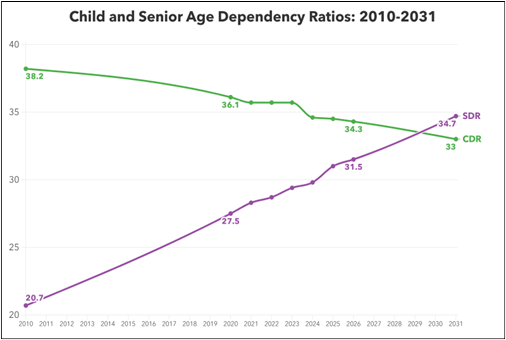
However, this relationship is anticipated to change in the future. The above chart illustrates the trend in these two measures over time using data from Esri Updated Demographics and the U.S. Census Bureau. In 2010, the gap between the two measures was substantially larger, with a CDR of 38.2 compared to an SDR of 20.7. Reflecting population aging at the national level, the SDR has increased steadily in recent decades, while the CDR has declined. The SDR is projected to surpass the CDR by 2031, with respective values of 34.7 and 33.
Note that these traditionally defined measures are approximations based solely on age and not adjusted for labor force participation by age. The ratios assume the entire working-age population aged 18 to 64 participates in the civilian labor force. Moreover, some individuals in the dependent child and senior populations participate in the labor force while the ratio assumes they do not.
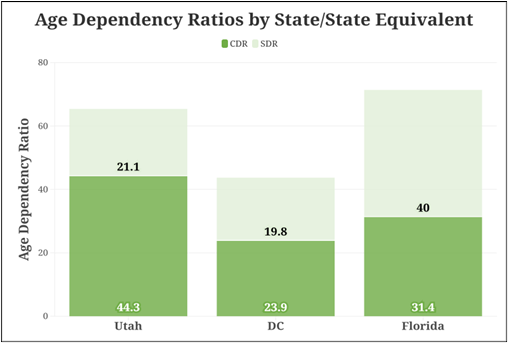
The ADR is a quick and valuable tool for understanding the age distribution and resulting dependencies within an area. These measures are also powerful comparative tools. Looking at the below chart, you can learn that Utah and Florida both have high ADRs, with values of 65.4 and 71.4, respectively. However, the age group contributions to the total ADR are different. Utah has a young population, with 44.3 of the 65.4 dependents (68 percent) coming from the child population. On the other hand, Florida has an older population with a more balanced split between children and senior dependents. By contrast, the District of Columbia (D.C.) has a low ADR. D.C. has only 43.7 dependents per 100 people from the working-age population, and 55 percent of those dependents are children under 18.
Economic Dependency Ratios
The Economic Dependency Ratio (EDR) is similar to the ADR, but it accounts for labor force participation by age. The EDR measures the relationship between nonworkers and the employed population. Nonworkers include children, the unemployed population, and those not in the labor force (that is, individuals who are neither working nor actively searching for work). Children are defined as the population under 16 years of age.
Four separate ratios are available:
The Child Economic Dependency Ratio (CEDR) is the population under 16 divided by the total employed population.
The Working-Age Economic Dependency Ratio (WEDR) is the population aged 16 to 64 who are not employed divided by the total employed population.
The Senior Economic Dependency Ratio (SEDR) is the population aged 65 and older who are not employed divided by the total employed population.
The total EDR is the sum of CEDR, WEDR, and SEDR.
Note:
All ratios are multiplied by 100. These measures exclude incarcerated populations and members of the armed forces.
In 2026, the U.S. EDR is 101.7, or 101.7 dependents for every 100 workers. Correspondingly, the U.S. CEDR is 37.1, or approximately 37 child dependents for every 100 workers. The WEDR is 33.7, or around 34 working-age dependents aged 16 to 64 for every 100 workers. The SEDR is 30.9, or nearly 31 senior dependents for every 100 workers. These values show that children make up the largest share of dependents; however, this can vary significantly depending on the area of the nation under examination.
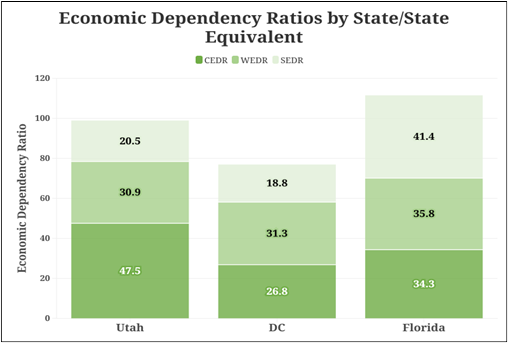
As the chart below indicates, Utah's large child population makes the CEDR the largest component of the total EDR, with a value of 47.5. Conversely, Florida has a large senior population that results in a high SEDR value of 41.4. D.C. has a relatively low EDR of 76.9, and the largest contributor is the nonworkers in the working-age population, resulting in a WEDR of 31.3 (41 percent).
A summary of ratio differences
Comparing the charts above reveals important details regarding how the dependency ratios can diverge. Key differences between the measures include the following:
The EDR incorporates employment and unemployment information. This can result in the EDR including portions of the working-age and senior populations in both the numerator and denominator of the calculation, depending on the age-specific labor force makeup of the study area.
The EDR is a civilian-only measure that does not include populations such as members of the armed forces and people who are incarcerated.
Three groups (child, working-age, senior) sum to the total EDR as opposed to only two groups (child, senior) that sum to the total ADR. This is necessary to account for dependents (unemployed, not in the labor force) in the population aged 16 to 64.
The cutoff between the child and working-age groups is age 16 for the EDR versus 18 for the ADR. Age 18 is used for the ADR because it corresponds with the standard definition of children. Age 16 is used for the EDR as it is the basic minimum age for employment.
Unlike the ADR, which is also calculated for 2031, the EDR is available only for 2026.