Create a template for an LRS feature count data product
 Available with the Linear Referencing license.
You can use the Data Product Designer wizard to create a template for a linear referencing system (LRS) feature count data product.
An LRS feature count data product provides information about the number of line events, point events, and intersections per route. You can find the number of pipeline crossings on a route or the number of In-line Inspection (ILI) anomalies along a route that is part of a pipeline. This type of information can be useful for planning and maintenance purposes.
The following diagram shows a sample feature count data product for Pipe 1:

Pipe 1 includes two routes, Route X and Route Y. The following table shows the distribution of pipeline crossings, ILI anomalies, and pipeline casing material types per route:
| Route Name | Line Name | Pipeline Crossings | ILI Anomalies | Steel Casing | Concrete Casing | PVC Casing |
|---|---|---|---|---|---|---|
| RouteX | Pipe1 | 1 | 3 | 1 | 1 | 0 |
| RouteY | Pipe1 | 1 | 2 | 0 | 0 | 1 |
An LRS feature count data product provides information about the number of line events, point events, and intersections per route. You can find the number of traffic signals on a route or the number of traffic signs along a highway that is traversing through multiple counties. This type of information can be useful for planning and maintenance purposes.
The following diagram shows a sample feature count data product for the SR 38 route:

SR 38 goes through two cities: Ames and Dover. The following table shows the distribution of signs, intersections, and speed limit line events for the route:
| City | Route ID | Intersections | Speed limit Signs | Stop Signs | Approaching Signal Signs | Speed Limit 20 | Speed Limit 40 |
|---|---|---|---|---|---|---|---|
| Ames | SR38 | 1 | 3 | 0 | 1 | 1 | 1 |
| Dover | SR38 | 2 | 2 | 1 | 1 | 1 | 1 |
The following workflow uses the Data Product Designer wizard to create a template to produce an LRS feature count data product similar to the one shown in the table above.
Choose an LRS data product type
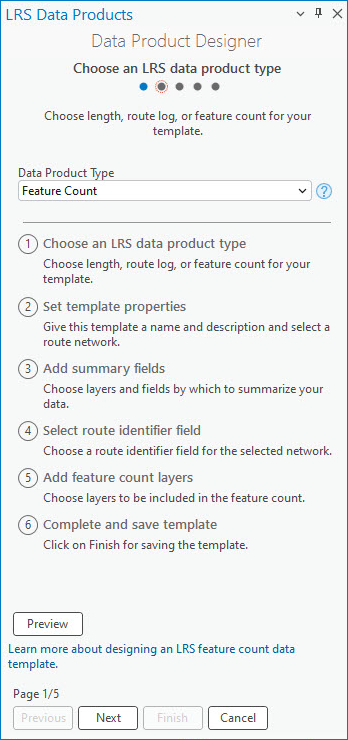
The first step in the Data Product Designer wizard is to specify the data product type.
To specify the Feature Count data product type, complete the following steps:
Start ArcGIS Pro and open a project with LRS data in the map.
On the Linear Referencing tab, in the Data Products group, click Data Product Designer
 .
The Choose an LRS data product type page of the Data Product Designer wizard appears.
Click the Data Product Type drop-down arrow and choose Feature Count.
Click Next.
The Set template properties page appears.
Set template properties
To set the template properties after you specify the template type, complete the following steps:
Provide a template name.
By default, the template is saved in the project folder. Optionally, browse to a different location, provide a name for the template, and click OK.
Click the Network drop-down arrow and choose a network.
The Generate LRS Data Product tool provides route characteristics for the network when you run it with the template.
Optionally, provide a description.
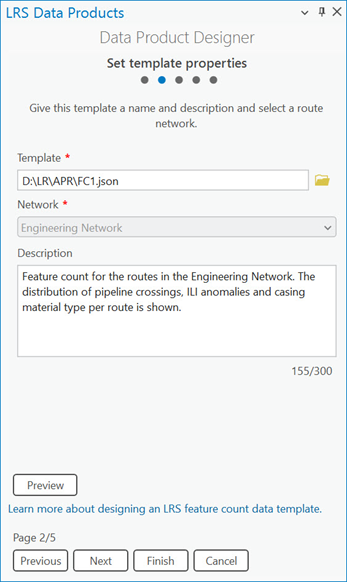
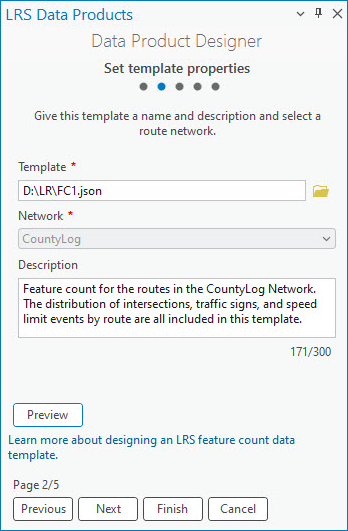
Optionally, click Preview to preview the information on a canvas.

Note:
If you are using a line network, the
Line Namecolumn appears next to the route identifier field in the feature count data product.Click Next.
The Add summary fields page appears.
Add summary fields
The next step is to choose summary layers and summary fields. A feature count can be based on unique values in the summary layer on a per-route basis. You can configure multiple summary layers. The summary layers are arranged and divided by levels based on their spatial relationships.
For example, you can configure a county boundary layer as level one and a city boundary layer as level two.
Note:
Adding summary fields is optional. If you don't want to add summary fields to the template, click Next to proceed to selecting a route identifier field.
To add summary fields, complete the following steps:
Click Add to create a blank row in the Summary Fields parameter.
Click the Summary Layer drop-down arrow and choose a summary layer.
The layer can be a polygon feature class or a line event that is registered to the network specified when setting the template properties. It must be in the same geodatabase or feature service and have the same projection as the specified network.
Click the Field drop-down arrow and choose a summary field.
After you choose a summary field, the Display Value Map section displays a table of the unique values in the summary field.
Optionally, edit the values in the Display Value column in the table.
Optionally, update the display name for the summary level in the Name in Table text box.
Optionally, click the Filter Expression drop-down arrow and define an expression to filter display values in the Display Value Map section.
To add multiple summary levels, repeat the previous steps for each level.
Click Next.
The Select a route identifier field page appears.
Click Add to create a blank row in the Summary Fields parameter.
Click the Summary Layer drop-down arrow and choose a summary layer.
The layer can be a polygon feature class or a line event that is registered to the network specified when setting the template properties. It must be stored in the same geodatabase or feature service and have the same coordinate system as the specified network.
For this example, City Boundary is the summary layer for the first level.
Click the Field drop-down arrow and choose a summary field.
For this example,
Nameis the summary field. This field contains the city names.After you choose a summary field, the Display Value Map section displays a table of the unique values in the summary field.
Optionally, edit the values in the Display Value column in the table.
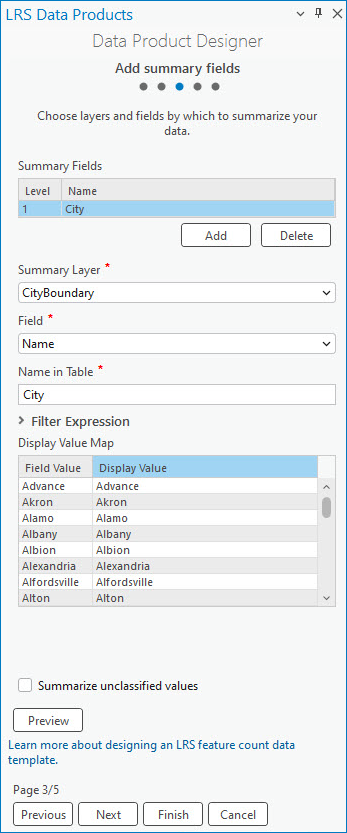

You can preview the template after adding a summary field. Optionally, update the display name for the summary layer in the Name in Table text box.
For this example, the display name is City.
Optionally, click the Filter Expression drop-down arrow and define an expression to filter display values in the Display Value Map section.
Optionally, check the Summarize unclassified values check box to summarize display values that are not included in the Display Value Map table.
Another value, Unclassified, is returned in the summary field.
By default, the Summarize unclassified values check box is not checked. This check box applies to all summary layers.
For this example, the Summarize unclassified values check box remains not checked.
To add multiple summary levels, repeat the previous steps for each level.
Click Next.
The Select a route identifier field page appears.
Select a route identifier field
The next step to produce a template for an LRS feature count data product is to add a route identifier field. The route identifier can be a route name or a route ID.
This example uses Route Name as the network's route identifier field.
This example uses ROUTE_ID as the network's route identifier field.
To specify a route identifier field, complete the following steps:
Click the Route Identifier drop-down arrow and choose a field.
The default option is Route ID if the specified network is a non-line network, or Route Name if the specified network is a line network.
If the specified network has both a route ID and a route name configured, you can choose one of the two options using the drop-down arrow.
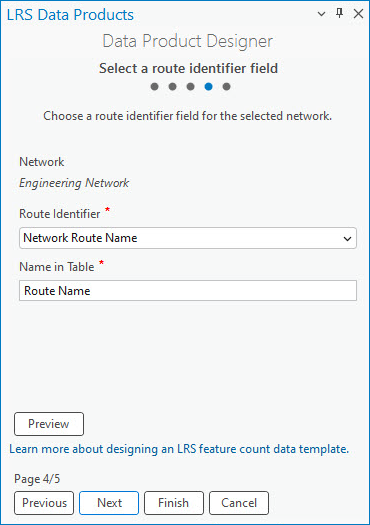
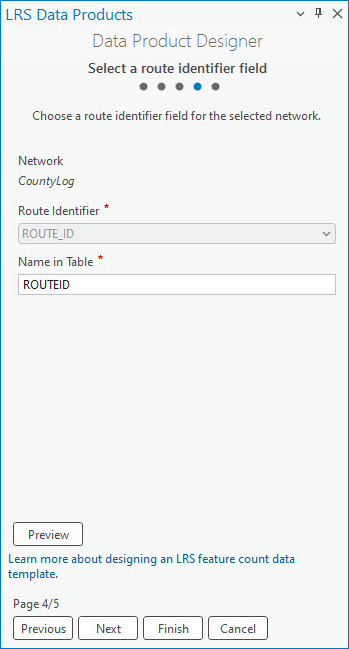
Optionally, update the display name in the Name in Table text box.
The default display name is the Route Identifier value.
Choosing a route identifier field ensures that the feature count data product generated using this template includes route information fields.
Optionally, click Preview to preview the route identifier field on a canvas.

Note:
If you are using a line network, the
Line Namecolumn appears next to the route identifier field in the feature count data product.Click Next.
The Add feature count layers page appears.
Add feature count layers
The LRS feature count data product counts line events, point events, and intersections on a per-route basis.
There are two options to configure the feature count fields: Single Value and Unique Values. You can configure the feature count fields one by one using the Single Value option and applying a filter to create categories. Alternatively, you can use the Unique Values option to configure all the unique values needed as feature count fields in the output.
To add feature count layers, complete the following steps:
Click Add to create a blank row in the Feature Count Fields parameter.
Click the Feature Count Layer drop-down arrow and choose a layer.
The layer must be stored in the same geodatabase or feature service and have the same coordinate system as the specified network.
The first feature count layer configured in the example is the Pipeline Crossing point event layer.
Click the Selection Method drop-down arrow and choose a selection method:
Single Value—Add a single feature count field.
Unique Values—Add multiple unique values for a feature count layer. Each unique value becomes an individual field. This option is only available when you provide a feature count layer without a name or filter.
For this example, Single Value is used to configure the Pipeline Crossing layer.
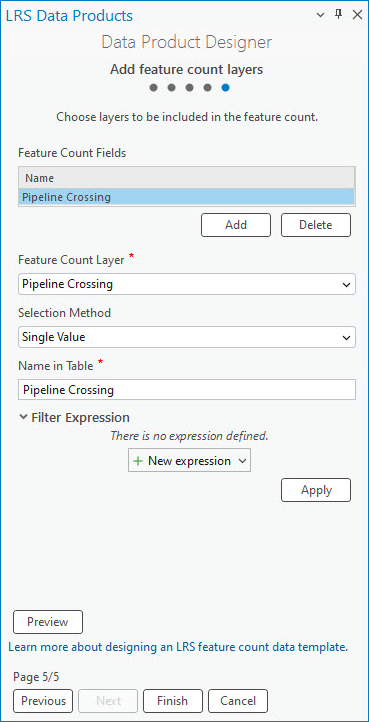
Provide a display name in the Name in Table text box.
The text provided here populates the blank row in the Feature Count Fields parameter.

You can preview the template after adding the Pipeline Crossing feature count field. Optionally, click New expression under Filter Expression and define an expression that filters the feature count layer.
To add another feature count field using the Single Value selection method, repeat the previous steps.
The second feature count layer configured in the example is the ILI Anomalies point event layer.

The next four feature count fields in the example are Concrete, Steel, PVC, and High Density Polyethylene. All four casing material types belong to the Casing line event layer. The following steps demonstrate how to add these fields using the Unique Values selection method.
Repeat step 1.
Click the Feature Count Layer drop-down arrow and choose a feature count layer.
For this example, the Casing layer is chosen as the feature count layer.
Click the Selection Method drop-down arrow and choose Unique Values.

A dialog box appears.
Click the Field drop-down arrow in the dialog box to choose a field, and do the following:
Check the check box next to each field to choose the unique values.
Optionally, update the name of each selected field in the Name column.
The name becomes the name of the feature count field when you add the unique values to the Feature Count Fields parameter.
Click Add to add the selected unique values as feature count fields.
Each feature count field automatically has Single Value as the selection method, as well as a filter expression that corresponds to the unique values.

Note:
The Unique Values selection method honors the values in coded value domains and subtypes.
Click Preview to verify the fields on the canvas.

Click Finish to save the template.
Click Add to create a blank row in the Feature Count Fields parameter.
Click the Feature Count Layer drop-down arrow and choose a layer.
The layer must be stored in the same geodatabase or feature service and have the same coordinate system as the specified network.
The first feature count layer configured in the example is the Intersections layer.
Click the Selection Method drop-down arrow and choose a selection method:
Single Value—Add a single feature count field.
Unique Values—Add multiple unique values for a feature count layer. Each unique value becomes an individual field. This option is only available when you provide a feature count layer without a name or filter.
For this example, Single Value is used to configure the Intersections layer.
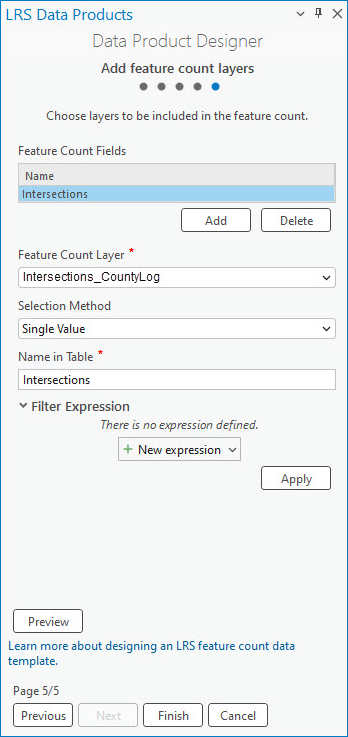
Provide a display name in the Name in Table text box.
The text provided here populates the blank row in the Feature Count Fields parameter.

You can preview the template after adding the Intersections feature count field. The next three feature count fields in the example are Speed Limit Signs, Stop Signs, and Approaching Signal Signs. All three sign types belong to the Signs point event layer. The following steps demonstrate how to add these fields together using the Unique Values selection method.
Repeat step 1.
Click the Feature Count Layer drop-down arrow and choose a feature count layer.
For this example, the Signs point event layer is chosen as the feature count layer.
Click the Selection Method drop-down arrow and choose Unique Values.

A dialog box appears.
Click the Field drop-down arrow in the dialog box to choose a field, and do the following:
Check the check box next to each field to choose the unique values.
Optionally, update the name of each selected field in the Name column.
The name becomes the name of the feature count field when you add the unique values to the Feature Count Fields parameter.
Click Add to add the selected unique values as feature count fields.
Each feature count field automatically has Single Value as the selection method, as well as a filter expression that corresponds to the unique values.

Note:
The Unique Values selection method honors the values in coded value domains and subtypes.
The final two feature count fields in the example are Speed Limit 20 and Speed Limit 40. Both values originate from the Speed line event layer. The following steps demonstrate how to add these fields by defining a filter expression.
Repeat step 1.
Click the Feature Count Layer drop-down arrow and choose a feature count layer.
For this example, the Speed line event layer is chosen as the feature count layer.
Click the Selection Method drop-down arrow and choose Single Value.
Provide a display name in the Name in Table text box.
The text provided here populates the blank row in the Feature Count Fields parameter.
In the example, the display name is Speed Limit 20.
Click New expression to define an expression that filters line events that have a speed limit of 20.

To add another feature count field by defining a filter expression, repeat steps 9 to 13.
For this example, another feature count field that includes line events that have a speed limit of 40 is configured.
Click Preview to verify the fields on the canvas.

Click Finish to save the template.
You can use the completed template in the Generate LRS Data Product tool to generate an LRS data product.
Note:
To review or edit an existing template, on the Set template properties page, click Browse for the template location  next to the Template text box. You can choose a template from the project folder or from other locations.