How Median Absolute Difference (MAD) Roughness works
 Available with the Spatial Analyst license.
The Median Absolute Difference (MAD) Roughness tool calculates a short-range roughness index using a simplified geostatistical approach (Trevisani, et al, 2023). The tool supports creating three output rasters—an omnidirectional roughness raster, a roughness anisotropy strength raster, and a roughness anisotropy direction raster.
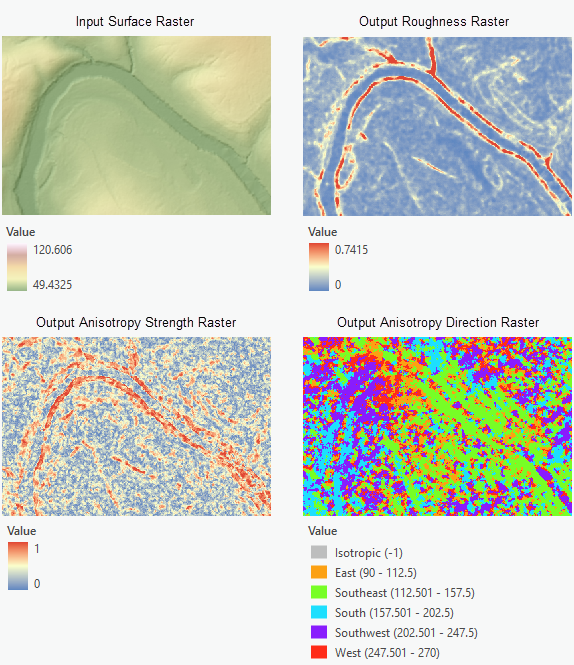
Median Absolute Difference (MAD) Roughness algorithm
To calculate the cell values for the Output Roughness Raster parameter value, the tool applies the following algorithm:
Compute four directional difference layers using the cell values from the input surface raster and the input Lag Distance parameter value.
Find median values at each cell location within the area specified by the Search Neighborhood Radius parameter value on the four directional difference layers.
Calculate the output roughness raster cell values as the mean of the four median values at each cell location. The cell values for the optional outputs are calculated using their respective equations.
The following sections provide more detail about how the tool calculates the output values.
Calculate directional second-order differences
At each input cell location, the tool computes second-order differences in four directions—East-West, North-South, Northeast-Southwest, Southeast-Northwest (Trevisani, et al, 2023). Depending on the input Lag Distance parameter value, the convolution kernel is either a 3-by-3 or a 5-by-5 moving window.
Convolution kernels for input lag distance = 1 cell
For input lag distance = 1 cell, the convolution kernel is a 3-by-3 moving window as shown below.
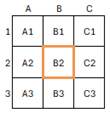
For the East-West direction, the directional second-order difference is computed using the following equation (formula 1):
\(D_1 = | 2*Z_{B2} – Z_{A2} – Z_{C2} |\)
Where Z is the cell value for a given cell in the neighborhood.
Similarly, for the North-South direction, the following is the equation (formula 2):
\(D_2 = | 2*Z_{B2} – Z_{B3} – Z_{B1} |\)
For the Northeast-Southwest direction, the following is the equation (formula 3):
\(D_3 = | -0.5 * Z_{A3} - 0.5 * Z_{C1} - 0.2071 * Z_{A2} - 0.2071 * Z_{B1} - 0.2071 * Z_{B3} - 0.2071 * Z_{C2} + 1.8284 * Z_{B2} |\)
For the Southeast-Northwest direction, the following is the equation (formula 4):
\(D_4 = | -0.5 * Z_{C3} - 0.5 * Z_{A1} - 0.2071 * Z_{C2} - 0.2071 * Z_{B1} - 0.2071 * Z_{B3} - 0.2071 * Z_{A2} + 1.8284 * Z_{B2} |\)
Convolution kernels for input lag distance = 2 cells
For an input lag distance = 2 cells, the convolution kernel is a 5-by-5 moving window as shown below.
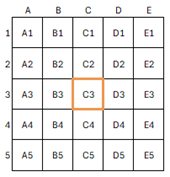
For the East-West direction, the directional second-order difference is computed using the following equation (formula 5):
\(D_1 = | 2*Z_{C3} – Z_{A3} – Z_{E3} |\)
For the North-South direction, the following is the equation (formula 6):
\(D_2 = | 2*Z_{C3} – Z_{C1} – Z_{C5} |\)
For the Northeast-Southwest direction, the following is the equation (formula 7):
\(D_3 = | 2 * Z_{C3} – 0.2426 * Z_{D1} – 0.1716 * Z_{E1} – 0.3431 * Z_{D2} – 0.2426 * Z_{E2} – 0.2426 * Z_{A4} –0.3431 * Z_{B4} – 0.1716 * Z_{A5} – 0.2426*Z_{B5} |\)
For the Southeast- Northwest direction, the following is the equation (formula 8):
\(D_4 = | 2 * Z_{C3} – 0.1716 * Z_{A1} – 0.2426 * Z_{B1} – 0.2426 * Z_{A2} – 0.3431 * Z_{B2} – 0.3431 * Z_{D4} – 0.2426 * Z_{E4} – 0.2426 * Z_{D5} – 0.1716 * Z_{E5} |\)
Calculate the output raster values
The following describes the steps involved in calculating the final output values for the primary and optional output rasters from this tool.
Compute the directional second-order differences.
For each cell in the input surface raster, locate a neighborhood centered on the current cell. If the input Lag Distance parameter value is 1 cell, the tool will use a 3-by-3 neighborhood. If the lag distance is 2 cells, the tool will use a 5-by-5 neighborhood.
Next, the tool computes the second-order differences in the four directions. If the input lag distance is 1 cell, the tool will use formulas 1 to 4. If the input lag distance is 2 cells, they will be formulas 5 to 8.
The result will be four difference layers corresponding to each of the four directions.
Compute median values.
For each cell location on the four difference layers resulted from Step 1, the tool computes the median values using the input search neighborhood. This will result in four median values that represent the four directions (\(E\), \(N\), \(NE\), \(SE\)) at each cell location.
Calculate the output cell values.
The four median values from Step 2 will be used to calculate the cell values for the output rasters.
For the Output Roughness Raster parameter value:
\[ \begin{align*} Roughness = \frac{(E + N + NE + SE)}{4} \end{align*} \]For the Output Anisotropy Strength Raster parameter value:
\[ \begin{align*} AnisotropyStrength = \frac{\sqrt{(NE - SE)^2 + (E - N)^2}}{(N + NE + E + SE)} \end{align*} \]For the Output Anisotropy Direction Raster parameter value:
\[ \begin{align*} AnisotropyDirection = 180 - (57.2957 \times 0.5 \times ATan2((NE - SE), (E - N))) \end{align*} \]Where:
\(E\) is the median absolute difference value in the East-West direction,
\(N\) is the median absolute difference value in the North-South direction,
\(NE\) is the median absolute difference value in the Northeast-Southwest direction,
\(SE\) is the median absolute difference value in the Southeast-Northwest direction.
Additional resources
See the following for more information:
Trevisani, S. Teza, G., Guth, P., 2023. "A simplified geostatistical approach for characterizing key aspects of short-range roughness." CATENA, Volume 223, ISSN 0341-8162, doi:10.1016/j.catena.2023.106927.