Time Series Smoothing (Spatial Statistics Tools)
Summary
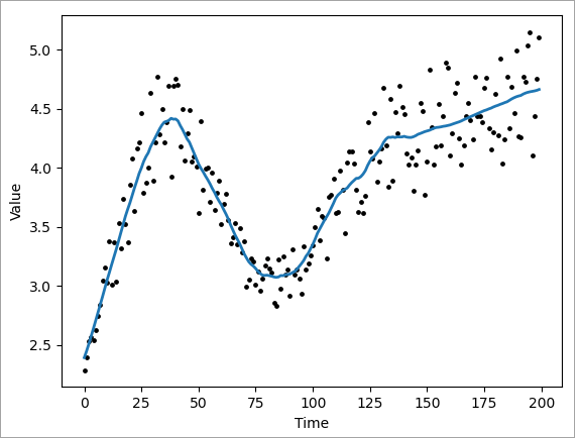
Smooths a numeric variable of one or more time series using centered, forward, and backward moving averages, as well as an adaptive method based on local linear regression. After smoothing short-term fluctuations, longer-term trends or cycles often become apparent.
Illustration
Usage
You can append the smoothed value fields to the input features or table using the Append Fields To Input Data parameter. If you append the fields to the input, the output coordinate system environment will be ignored. If the input features or table have joined fields, you cannot append to the input data and must create a new output.
The Time Field parameter specifies the time of each input record. There cannot be more than one value at the same time in the same time series.
The Analysis Field parameter specifies the values that will be smoothed. When smoothing a value of the analysis field, only nonnull values within the time window are used. If all values of the analysis field are null within a time window, the smoothed value will be null.
Multiple time series can be specified using the Grouping Method parameter. You can group all values at the same location into the same time series, group values using an ID field, or group all values (regardless of location) into the same time series. If you group values, ensure that all groups have multiple records with different times so that smoothing can be performed within each group.
Due to leap years and differing days of the month, if the Time Window parameter unit is years or months, the time value must be an integer. For example 1.5 months results in a different time window depending on the month. For forward and backward moving averages, the time window can be any positive integer. For centered moving averages and adaptive bandwidth local linear regression, the time window must be a positive even integer so that when it is split on each side of the record being smoothed, each side results in a positive integer.
When the Enable time series pop-ups parameter is checked, the tool will create a chart for each time series and add the chart to the first feature record in each time series. On a 2D map, select a feature to view the chart in the pop-up. In a 3D scene, select the first feature in the time series to view the chart in the pop-up.
Note:
If a grouping method is used, the first feature from each time series may not draw first in the map. To access the pop-ups for these features, right-click the record in the attribute table.
Parameters
| Label | Explanation | Data type |
|---|---|---|
|
Input Features or Table |
The features or table containing the time series data and the field to smooth. |
Table View |
|
Time Field |
The field containing the time of each record. |
Field |
|
Analysis Field |
The field containing the values that will be smoothed. |
Field |
|
Grouping Method (Optional) |
Specifies the method that will be used to group records into different time series. Smoothing is performed independently for each time series.
|
String |
|
Smoothing Method (Optional) |
Specifies the smoothing method that will be used.
|
String |
|
Time Window (Optional) |
The length of the time window. The value can be provided in seconds, minutes, hours, days, weeks, months, or years. For backward, forward, and centered moving averages, the value and unit must be provided. For adaptive bandwidth local linear regression, the value can be left empty and a time window will be estimated independently for each value. Values that fall on the border of the time window will be included within the window. For example, if you have daily data and you use a backward moving average with a time window of four days, five values will be included in the window when smoothing a record: the value of the record and the values of the four previous days. |
Time Unit |
|
Append fields to input data (Optional) |
Specifies whether the output fields will be appended to the input dataset or saved as a new output table or feature class. If you append the fields to the input, the output coordinate system environment will be ignored.
|
Boolean |
|
Output Features (Optional) |
The output features containing the smoothed values as well as fields for the time window and number of neighbors. |
Feature Class; Table |
|
ID Field (Optional) |
The integer or text field containing a unique ID for each time series. All records with the same value of this field are part of the same time series. |
Field |
|
Apply shorter time window at start and end (Optional) |
Specifies whether the time window will be shortened at the beginning and end of each time series.
|
Boolean |
|
Enable time series pop-ups (Optional) |
Specifies whether the output features or table will include pop-up charts showing the original and smoothed values of the time series.
|
Boolean |
Derived output
| Label | Explanation | Data type |
|---|---|---|
|
Updated Features or Table |
The updated input table or feature class with the output fields appended. |
Table View |
Environments
Licensing information
- Basic: Yes
- Standard: Yes
- Advanced: Yes