Resource management
Review the compute (processing) and memory utilization of ArcGIS Velocity directly in the app. There are two ways to view compute and memory utilization in the Velocity app. On the Home page, under the Resource Utilization section, you can view a summary of overall compute and memory consumption. Alternatively, for detailed information, go to the Utilization tab in the main menu and select the Compute or Memory option to open the Compute Utilization or Memory Utilization page.
Resource utilization dashboard
The Home page in the Velocity app displays a dashboard indicating resource utilization. The dashboard shows the amount of compute (processing) and memory that Velocity processes use as percentages.
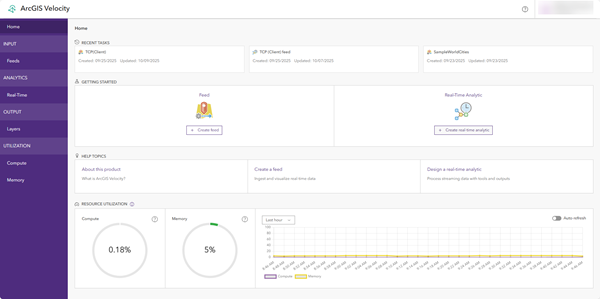
You may receive an error message when you start a feed or analytic if there is insufficient capacity to run it. A graph displays a history of the compute (processing) and memory utilization with selectable intervals of hour, day, and week. Use the graph to understand the processing load and memory utilization over time.
Turn the Auto-Refresh option on and off when actively starting and stopping feeds and analytics to see the immediate impacts.
Compute utilization
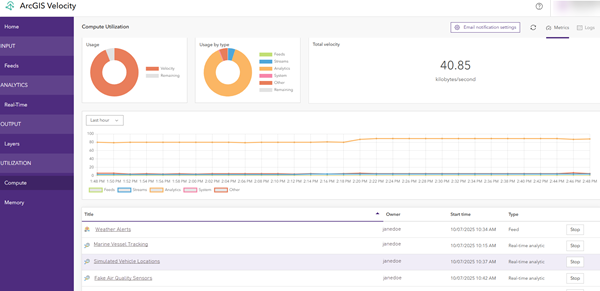
The Compute Utilization page provides information about the feeds and analytics that are actively running, including ownership, start time, and item type. Each item's title links to the details page for that item in the Velocity app.
The Usage chart displays compute metrics as a total compute consumption by Velocity processes versus the remaining compute capacity. The Usage by type chart shows compute usage for feeds, streams, real-time analytics, and system-level components. Velocity displays processes external to Velocity that also use compute resources as Other.
The Total velocity counter shows the velocity or the processing speed of feature records in kilobytes per second.
Feed and real-time analytic items appear sorted by start time and type. You can stop running items listed in the table.
The Compute Utilization page automatically refreshes every 15 seconds.
Memory utilization
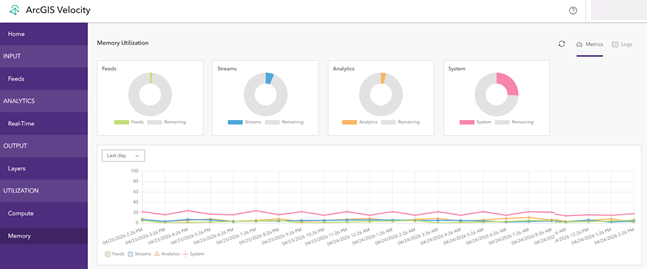
The Memory Utilization page in the Velocity app provides information about the JVM memory usage for Velocity services, relative to the total JVM memory allocated to that service. Monitor memory usage for Velocity services from both the Memory Utilization page and the Home page.
The Feeds, Streams, Analytics, and System charts display memory consumption grouped by service category. These categories represent the underlying Velocity services responsible for feeds, streams, real-time analytics, and system-level components. In each chart, the colored portion shows the amount of JVM memory currently in use by the service, while the gray portion represents the remaining allocated JVM memory that is available. Use this view to identify services that are approaching their configured JVM memory limits.
The time-series chart displays memory usage trends for each service over time. The service categories include feeds, streams, analytics, and system, with each category visually distinguished using colors and marker styles. Compare memory usage trends and identify memory consumption patterns for each Velocity service over time. Use the drop-down menu to adjust the time range to the Last hour, Last day, or Last week options.
Memory allocation for each Velocity service is managed through the Velocity Administrator directory. By default, each service is configured with a minimum of 500 MB and a maximum of 2048 MB of memory. When allocating RAM for Velocity, consider all applications running on the machine.
Learn more about viewing and modifying memory allocation settings
The Memory Utilization page automatically refreshes every 15 seconds.