
字段统计数据转表 (数据管理工具)

汇总

为表或要素类中的一个或多个输入字段创建描述性统计表。

插图
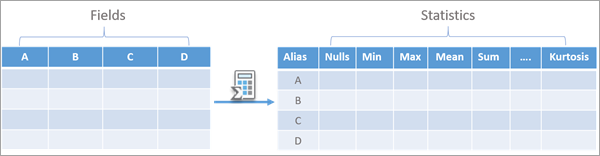
字段统计数据转表工具图示

用法

  • 该工具可接受要素类或独立表作为输入。

  • 对于输入字段参数,可以指定多个可计算统计数据的字段。 该参数接受数值(短整型、大整型、长整型、浮点型和双精度型)、文本或日期(日期、仅日期、仅时间和时间戳偏移)类型字段。

  • 输入字段参数指定的字段顺序将是输出表中行的顺序。

  • 分组依据字段参数用于为指定字段中的每个唯一值分别计算输入字段统计数据。 每个输入字段的统计数据将按分组依据字段中的每个唯一值计算和报告一次。

  • 输出表参数为字段类型列提供了四个选项:

    • 全部—所有输入字段和输出统计数据,无论字段类型如何,都将导出到单个输出表。

    • 数值—仅导出数值类型输入字段(短整型、大整型、长整型、浮点型和双精度型),并且仅将适用于数值字段类型的统计数据导出到输出表。

    • 文本—仅导出文本类型输入字段,并且仅将适用于文本字段类型的统计数据导出到输出表。

    • 日期—仅导出日期类型输入字段(日期、仅日期、仅时间、时间戳偏移),并且仅将适用于日期字段类型的统计数据导出到输出表。

    对于每个输出表,在输出表参数的输出名称列中指定表的名称,该表将保存在由输出位置参数指定的工作空间中。

  • 可以使用输出统计数据参数配置输出统计及其字段名称。 如果未为此参数提供任何值,则所有适用的输出统计数据均将包含在输出表中。 下表列出了输出表参数的字段类型列的每个选项的可用统计数据和相应的输出字段类型:

    输出统计数据

    全部

    数值

    文本

    日期

    字段名

    文本

    文本

    文本

    文本

    别名

    文本

    文本

    文本

    文本

    字段类型

    文本

    文本

    文本

    文本

    长整型

    长整型

    长整型

    长整型

    最小值

    文本

    双精度

    -

    日期

    最大

    文本

    双精度

    -

    日期

    平均值

    文本

    双精度

    -

    日期

    标准差

    双精度

    双精度

    -

    -

    中值

    文本

    双精度

    -

    日期

    计数

    长整型

    长整型

    长整型

    长整型

    唯一值数

    长整型

    长整型

    长整型

    长整型

    众数

    文本

    双精度

    文本

    日期

    最不常见

    文本

    双精度

    文本

    日期

    异常值

    长整型

    长整型

    -

    -

    总和

    双精度

    双精度

    -

    -

    范围

    文本

    双精度

    -

    文本

    四分位距

    双精度

    双精度

    -

    -

    第一四分位数

    文本

    双精度

    -

    日期

    第三四分位数

    文本

    双精度

    -

    日期

    变化系数

    双精度

    双精度

    -

    -

    偏度

    双精度

    双精度

    -

    -

    峰度

    双精度

    双精度

    -

    -

  • 可用的统计数据与 数据工程视图 中的可用统计数据相同。 有关如何计算每个统计数据的详细信息,请参阅 与统计数据交互

  • 如果您为输出表参数的字段类型列选择全部,则所有字段类型都将导出到单个表中。 这可以帮助您一次可视化所有输入字段及其统计数据。 这为某些应用程序提供了优势;例如,在布局或报表中使用统计数据时可能更喜欢使用它。 但是,将不同的字段类型导出为单个表有一些注意事项。 某些字段类型通用的统计选项(包括众数最不常见最小值最大值)将作为文本字段存储在输出表中。 这可能会导致问题,例如,在统计数列中对这些值进行排序或在模型中链接输出统计数据时。 表中也会有空像元,因为某些统计数据不适用于文本或日期字段。

  • 如果您为输出表参数的字段类型列选择数值文本日期,则每个字段类型将导出到单独的表中,并且输出表将仅包含适用于该字段类型的统计数据。 某些适用于多种字段类型的统计数据将以与输入字段类型匹配的格式存储。 例如,在“数值”表中,最小值字段的类型为双精度型,而在“日期”表中则为日期型。 建议您使用不同的输出表。 例如,要将统计数据保存为与输入字段相同的类型,请对输出表中的统计数据进行排序或在模型中使用它们的值。

  • 如果出现频率相同,输出统计数据参数的统计数据列的众数最不常见选项可以对应于输入字段中的多个值。 在这种情况下,数值、文本和日期输出表的多个值将报告为 <Null>。 对于全部选项,输出像元将包含文本“多个值”。

参数

标注 说明 数据类型

输入表

包含用于创建统计数据表的字段的输入表。

Table View

输入字段

包含用于计算统计数据的值的字段。

Field

输出位置

要创建输出表的位置。 位置可以为地理数据库、文件夹或要素数据集。

Workspace

输出表

包含统计数据的输出表。 字段类型列用于指定将包含在每个输出表中的字段类型,每个输出表的名称在输出名称列中提供。 例如,您可以创建一个包含所有字段类型的汇总表,或者您可以为数值、文本和日期字段类型创建单独的汇总表。

值表列:

  • Field TypesSpecifies the field types that will be included in each output table.

    • NumericA table summarizing numeric fields of the input (Short, Long, Float, and Double types) will be created.

    • TextA table summarizing text fields of the input (Text type) will be created.

    • DateA table summarizing date fields of the input (Date type) will be created.

    • AllA table summarizing all numeric, text, and date fields of the input will be created.

  • Output NameThe name of each output table.

Value Table

分组依据字段

(可选)

将用于对行进行分组的字段。 如果提供了分组依据字段,则输入的每个字段将在输出表中显示为一行,各分组依据字段中每个唯一值都会显示一次。

Field

输出统计数据

(可选)

指定将汇总的统计数据以及包含统计数据的输出字段名称。 将在统计数据列中提供统计数据,并在输出字段名称列中提供输出字段的名称。 如果没有提供任何值,则系统将为针对所有输入字段计算所有适用的统计数据。

仅适用于输入字段的统计数据才可用。

值表列:

  • StatisticSpecifies the statistic type that will be used.

    • Field nameThe name of the field.

    • AliasThe alias of the field.

    • Field typeThe field type of the field (Short, Long, Double, Float, Text, or Date).

    • NullsThe number of records containing null values in the field.

    • MinimumThe smallest value in the field.

    • MaximumThe largest value in the field.

    • MeanThe mean (sum divided by total count) of all values in the field. To calculate the mean date for date fields, each date is converted to a number by calculating the difference between the date and a reference date (for example, 1900-01-01), calculated in milliseconds.

    • Standard deviationThe standard deviation of the values in the field. It is calculated as the square root of the variance, in which the variance is the average squared difference of each value from the mean of the field.

    • MedianThe median for all values in the field. The median is the middle value in the sorted list of values. If there is an even number of values, the median is the mean of the two middle values in the distribution.

    • CountThe number of nonnull values in the field.

    • Number of unique valuesThe number of unique values in the field.

    • ModeThe most frequently occurring value in the field.

    • Least commonThe least common value in the field.

    • OutliersThe number of records with outlier values in the field. Outliers are values that are more than 1.5 times the interquartile range above the third quartile or below the first quartile of the values of the field.

    • SumThe sum of all values in the field.

    • RangeThe difference between the largest and smallest values in the field.

    • Interquartile rangeThe range between the first quartile and the third quartile of the values in the field. This represents the range of the middle half of the data.

    • First quartileThe value of the first quartile of the field. Quartiles divide the sorted list of values into four groups containing equal numbers of values. The first quartile is the upper limit of the first group in ascending order.

    • Third quartileThe value of the third quartile of the field. Quartiles divide the sorted list of values into four groups containing equal numbers of values. The third quartile is the upper limit of the third group in ascending order.

    • Coefficient of variationThe coefficient of variation of the values in the field. The coefficient of variation is a measure of the relative spread of the values. It is calculated as the standard deviation divided by the mean of the field.

    • SkewnessThe skewness of the values in the field. Skewness measures the symmetry of the distribution. The skewness is calculated as the third moment (the average of the cubed data values) divided by the cubed standard deviation.

    • KurtosisThe kurtosis of the values in the field. Kurtosis describes the heaviness of the tails of a distribution compared to the normal distribution, helping identify the frequency of extreme values. The kurtosis is calculated as the fourth moment (the average of the data values taken to the fourth power) divided by the fourth power of the standard deviation.

  • Output Field NameThe name of the output field

Value Table

派生输出

标注 说明 数据类型

数值字段的输出表

数值数据类型的输出表。 该表将保存在由输出位置参数指定的工作空间中。

Table

文本字段的输出表

文本数据类型的输出表。 该表将保存在由输出位置参数指定的工作空间中。

Table

日期字段的输出表

日期数据类型的输出表。 该表将保存在由输出位置参数指定的工作空间中。

Table

所有字段的输出表

所有数据类型的输出表。 该表将保存在由输出位置参数指定的工作空间中。

Table

环境

此工具不使用任何地理处理环境。

许可信息

  • 基本: 是
  • 标准: 是
  • 高级: 是