Accessibility in basemaps
A basemap provides the foundational layer of geographic context for a map or scene.
It shows spatial relationships between features and baseline data such as land, water, roads, buildings, cities, places, and administrative boundaries.
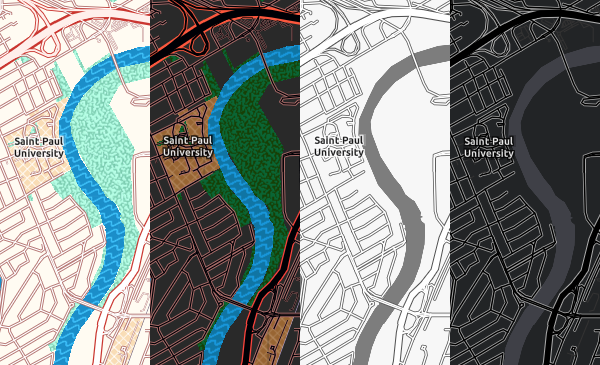
Choose the right basemap for your data, audience, and purpose. If the data uses a lot of visual symbology and colors, explore muted options such as Light Gray Canvas or Human Geography Map. If detailed street data helps orient your audience to an unfamiliar region, consider the Enhanced Contrast Map and Enhanced Contrast Dark Map basemaps.
Note:
The enhanced-contrast basemaps and Human Geography Map only apply to 2D basemaps.
Custom basemap
A highly detailed basemap may increase cognitive load, especially for those who are neurodivergent. If you use vector tile basemaps, remove or reduce visible labels at different zoom levels to create a customized basemap.
Note:
With the Vector Tile Style Editor, you can adjust the opacity and typography of labels, change landmark and label colors, and control zoom levels for labels, or hide them completely.
Multiple choices
Administrators can customize their organization’s basemap gallery. The gallery populates the basemap switcher, which provides alternative options to the target audience. This allows visitors to adjust based on their preferences.
In some apps, map authors can include a basemap toggle button for a single alternative.