Visualize Data in ArcGIS AllSource
Maps and scenes show 2D and 3D geospatial information.
Build maps to display geospatial data in an interactive view.
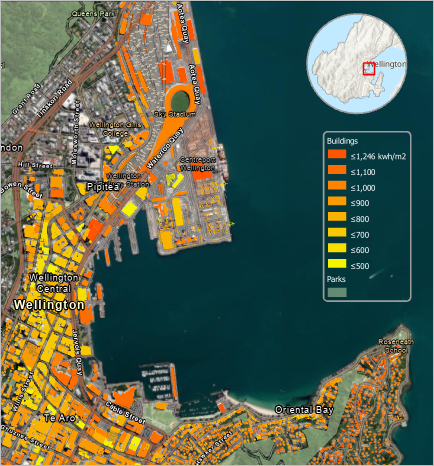
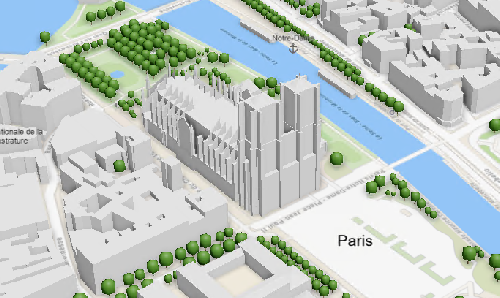
Visualize geospatial data in three dimension view with scenes.
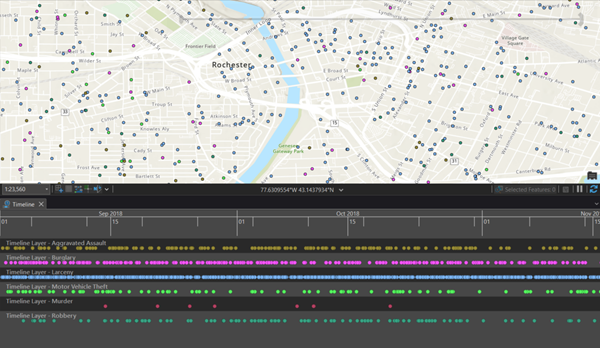
Use the time slider and timelines to see temporal data sequentially.
Visualize change over time with time-enabled data. Use the time slider to animate temporal change in a map or scene.
Timelines show the order and sequence of events in a linear graph of time.
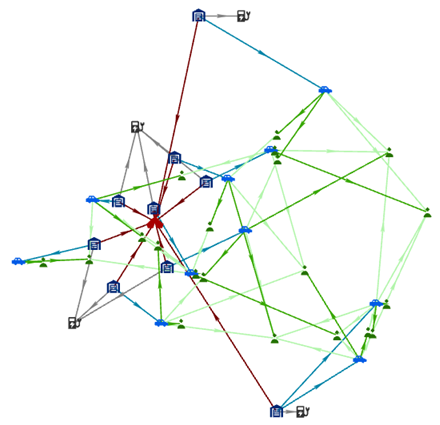
Use knowledge graphs and link charts to visualize relational information.
See the connections between people, objects, places, events by creating a graph network in ArcGIS Knowledge.
Note:
ArcGIS AllSource help documentation references ArcGIS Pro documentation. While the ArcGIS Pro documentation may use different tool locations or ArcGIS Pro-specific license information than ArcGIS AllSource, the concepts and details and capabilities described are accurate and correct for both products and are expected to function the same way. Learn more about the ArcGIS AllSource help system.