Work with maps and nearby panels
Maps and nearby panels add location-based context to an infographic. Using these panel types, you can display information about point locations or geographic features near your sites.
Add a map panel
To add a map panel to an infographic template, start by selecting a basemap or ArcGIS map on which to display data. This basic map automatically shows the location of the site where you run the infographic. You can also link the map panel to web maps and layers, as well as other elements in the infographic template. You can set preferences for the comparison geographies used in infographic maps in the app preferences.
Note:
Infographics can display up to 12 maps. When you add map panels to your infographic, consider how many will be displayed if you run side-by-side comparisons.
To add a map panel, complete the following steps:
In the infographic builder, click Add element.
Alternatively, hover over an existing panel and click Add
 or Replace
 .
Select Map
 .
The Browse and select maps window appears.
On the Basemaps tab, select a basemap for the panel.
Alternatively, click the ArcGIS tab and provide a URL or click Browse ArcGIS to choose a map from your organization, ArcGIS Living Atlas, or other ArcGIS web maps and layers. For more information, see Add web maps and layers.
The map panel is added to the infographic template.
Customize a map panel
You can use the Panel options and Map properties windows to modify a map panel. You can also add elements to the panel, such as images or charts.
To customize a map panel, complete the following steps:
Hover over a map panel and click Edit
 .
Click Panel options
 and use the Background color swatch to select a color. Check the Crop content check box to limit the view of elements to the borders of the panel.
Hover over the panel and click Edit map
. Check the Show map legend check box to turn the legend on or off. Use the Dimensions and Arrange & position sections to adjust the dimensions and position of the panel.Click Change map to select a different basemap or ArcGIS web map for the panel.
To add layers to the map, see the Add layers to a map panel section below.
To add an element to the panel, click Add element and select from the options.
You can add a title, subtitle, image, shape, text box, variable indicator, chart, or map.
When you are finished, click Apply.
Add layers to a map panel
Adding layers to a map panel allows you to link the map to data in your project, in the current template, and in ArcGIS.
To add layers to a map panel, complete the following steps:
Hover over a map panel and click Edit
.Hover over the panel and click Edit map
.In the Map properties window, click Add other layers.
In the Add layers to map window, click Add layer, and choose from the following:
Add layer from project—Add point layers from the current project.
Browse ArcGIS Online—Add web maps or layers from your organization, ArcGIS Living Atlas, or other ArcGIS web maps and layers.
Associate existing nearby locations table—Add locations from a nearby panel in the current infographic. If there is more than one nearby panel in the infographic, click Add to select one. You can use the Symbol drop-down menu to alter the point symbols.
If you added multiple layers, you can hover over a layer and drag it to modify the display order of the layers.
When you are finished adding and ordering layers in the map panel, click Apply.
The window closes and the map panel is displayed in edit mode.
When you are finished modifying the map panel, click Apply.
Add a nearby panel
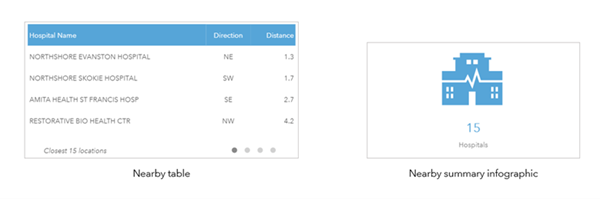
A nearby panel summarizes information about point locations near a site. You can show the locations as a table with attributes or as a summary infographic. For example, you can create a nearby panel showing hospitals near your site and display it in either format as shown in the following image:
Add a ready-to-use nearby panel
You can add a standard nearby panel to an infographic template. These ready-to-use panels allow you to select and display demographic and business categories included with Business Analyst.
To add a ready-to-use nearby panel, complete the following steps:
In the infographic builder, click Add element.
Alternatively, hover over an existing panel and click Add
or Replace .Select Nearby
 .
The Add nearby locations window appears.
In the Add nearby locations window, do one of the following:
Hover over Nearby points of interest and click Select Business Type.
Hover over Nearby traffic and click Add.
If you chose Nearby points of interest, search for points of interest and click Next.
Note:
For countries that have multiple POI data sources, use the Data source drop-down menu to select a data source. Use the Esri Categories classification system for a unified search.
Optionally, click Edit attributes and filters to modify the attributes that are displayed in the table and filter the results.
Format the display options for the panel by doing the following:
Choose Show as table or Show as summary infographic.
Depending on which you select, customize the table's or summary infographic's appearance, including the maximum number of locations. For both tables and summary infographics, the maximum is 5,000 locations.
Check the Add the resulting nearby location points to the map check box to display the nearby points on a map in the infographic. If a map panel has been added, the table is linked automatically to that map. If there is no map in the infographic, checking this box creates a new map panel.
Click Apply.
If you linked the nearby panel to a map panel and there is more than one map panel in the infographic, the Select map window appears.
Click Add to select a map panel.
The panel is added to the template.
Add a custom nearby panel
You can create your own nearby panel using a point layer from the current project, web maps and layers from ArcGIS, Esri layers, or a layer created from a POI search.
To add a custom nearby panel to an infographic, complete the following steps:
In the infographic builder, click Add element.
Alternatively, hover over an existing panel and click Add
or Replace .Select Nearby
.The Add nearby locations window appears.
In the Add nearby locations window, select one of the following:
Layer from project—Select a point layer from the current project as the source for nearby locations.
Browse for a layer on ArcGIS—Select web maps or layers from your organization, ArcGIS Living Atlas, or other ArcGIS web maps and layers.
Use Esri layers—Select from the list of available Esri layers.
Start a new points of interest search and return to this workflow to use that layer—Perform the points of interest search workflow and continue building the infographic.
Note:
If you selected Browse for a layer on ArcGIS, the maximum number of locations returned is limited to the maximum record count set on the feature layer that is used from ArcGIS Online.
Once you have selected a point layer, select attributes to include in the nearby panel.
Optionally, use the check boxes to deselect the attributes automatically included in nearby panels: Direction to site and Distance from site.
Click Next.
Optionally, filter the results using a keyword, such as coffee, or attribute from the point layer, and click Add group to create combinations of filters.
Click Next.
Format the display options for the panel by doing the following:
Choose Show as table or Show as summary infographic.
Depending on which you select, customize the table's or summary infographic's appearance and calculation options.
Check the Add the resulting nearby location points to the map check box to display the nearby points on a map in the infographic. If a map panel has been added, the table is linked automatically to that map. If there is no map in the infographic, checking this box creates a new map panel.
Click Apply.
If you linked the nearby panel to a map panel and there is more than one map panel in the infographic, the Select map window appears.
Click Add to select a map panel.
The panel is added to the template.
Customize a nearby panel
You can use the More options window to modify a nearby panel. You can also modify the attribute fields and filters.
To customize a nearby panel, compete the following steps:
Hover over a nearby panel and click Edit
.Click More options
to open the More options window.Note:
You can also open the More options window by hovering over a nearby table and clicking Edit table style and number of locations, or by hovering over a nearby summary infographic and clicking Edit infographic style.
Edit the panel by doing any of the following:
For Nearby points of interest panels, click Edit search settings to modify the points of interest displayed.
Click Edit attributes to modify the attributes in the nearby panel.
Click Edit filters to modify the attribute fields and filters.
Customize the display style of the panel, including the number of locations shown, the title, and the format (including transposing the table layout, grouping, sorting, ordering of results).
Use the check boxes to turn on additional nearby panel layout options, such as scaling the table to fit the panel, showing the count of locations in the table footer, enabling filtering, and viewing the table as a chart.
When the panel is in edit mode, do any of the following:
Optionally, hover over the nearby panel and click Edit attributes and filters. You can filter the results using a keyword, such as coffee, or an attribute from the point layer. Click Add group to create combinations of filters.
If the panel is a premade Nearby points of interest panel, you can hover over the panel and click Change the business type to select another category.
Hover over the panel and click Switch to display as summary count or Switch to display as table to change the display style of the nearby panel.
If the panel was created from a layer, click View source layer info to open the layer information on a new tab.
When you are finished customizing the nearby panel, click Apply.