Esri Diversity Index methodology
Esri creates Diversity Index data as part of the Updated Demographics dataset for the United States. This topic describes the methodology used to create that data.
Tip:
Esri also provides a copy of this topic as a technical paper: 2026 Esri Diversity Index (PDF).
About Esri's Diversity Index
Tracking the diversity of our society is crucial to understanding the shifting demographics of race and ethnicity in the United States. Esri's Diversity Index captures the racial and ethnic diversity of a geographic area in a single number, from 0 to 100. The Diversity Index allows for efficient analysis and mapping of seven race groups that can be either of Hispanic or non-Hispanic origin—a total of 14 separate race/ethnic groupings.
Based on the data standards established by the U.S. Office of Management and Budget, the U.S. Census Bureau considers race and ethnicity to be two separate and distinct concepts. Hispanic Origin refers to ethnicity, not race, and is viewed as the heritage, nationality, lineage, or country of birth of the person or the person's parents or ancestors before arriving in the United States. Due to the use of the decennial census as a base, Esri Updated Demographics reflect these same standards. Race is reported as White, Black or African American, Asian, American Indian and Alaska Native, Native Hawaiian and Other Pacific Islander, Some Other Race, and Multiple Races. Ethnicity is reported as Hispanic or Non-Hispanic. By treating race and ethnicity as two independent data points, Esri's Diversity Index compounds racial diversity with ethnic diversity to provide an inclusive understanding of diversity. Explore the Guide to Diversity Index Data (in ArcGIS StoryMaps format) for additional interpretation guidelines and practical tips for using the Diversity Index.
A summary of the updates to methodology in this release
Over the last 50 years, the racial and ethnic diversity of the United States has changed, with the most significant increase in the Hispanic population. From 2010 to 2020, the Hispanic population increased by 23 percent, whereas the non-Hispanic population grew by 4.3 percent. In 1970, Hispanics accounted for 4.7 percent of the population. Today, Hispanics represent 19.9 percent of the 2026 population, which is expected to grow to 21 percent by 2031. Although immigration has largely contributed to gains in diversity over the past half-century, there are new forces driving diversity across the country. Native births have become a primary source of diversification. It is estimated that births currently account for around 72 percent of the Hispanic population growth since 2010 ¹.
More than half of all children born in the United States are minorities, defined as any race/ethnicity other than non-Hispanic White. Minorities accounted for 36.1 percent of the population in 2010 and are expected to make up 46 percent of the population by 2031. That reduces the majority (non-Hispanic Whites) share of the population from 63.9 percent to 54 percent. An important contributing factor to this shift is the increase in the size of the population reported as belonging to multiple racial groups, which changed from 2.9 percent of the total population in the 2010 Census to 10.2 percent in the 2020 Census. This shift can be attributed to multiple factors, including changes to the census race question ², changes to how the Census Bureau processed the data, and changes to how respondents self-identified compared to the last decade.
The non-Hispanic White population is aging. Younger non-Hispanic Whites are marrying later in life and having fewer children. There are now more deaths than births for the non-Hispanic White population, a process called natural decrease. This shift can be seen in the first chart below and juxtaposed with the second chart showing the natural increase in the Hispanic population.
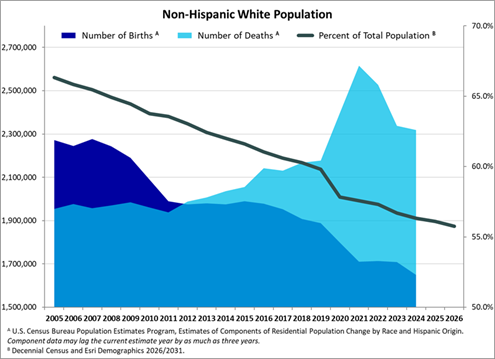
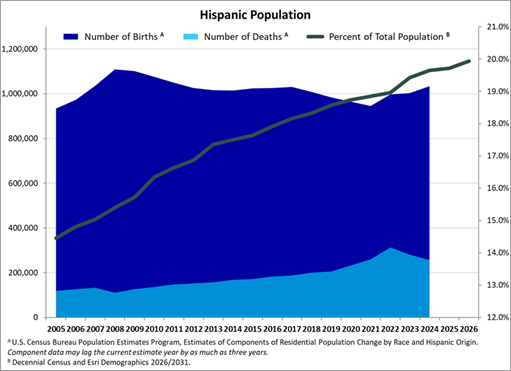
Geographically, the largest gains in diversity occur in areas that previously had the least diversity. Micropolitan statistical areas and rural areas are experiencing higher rates of diversification than metropolitan statistical areas. Regionally, diversification in the Midwest, Northeast, and South is outpacing the West. These trends are likely to continue as the population of minority groups expands into areas that are currently dominated by the non-Hispanic White population. Variations in the Diversity Index and the annual rate of change for different geographic areas are shown in the following two tables below (2020-2026 Diversity Index changes by geography and the forecasted 2026-2031 changes).
This table shows the 2020-2026 Diversity Index annual change by regional geography:
| Geography | Census 2020 | Update 2026 | Annual change percent |
|---|---|---|---|
| U.S. | 71.0 | 73.0 | 0.4% |
| Midwest | 51.8 | 54.2 | 0.7% |
| Northeast | 66.9 | 69.1 | 0.5% |
| South | 72.5 | 74.5 | 0.4% |
| West | 80.3 | 81.4 | 0.2% |
| Metropolitan areas* | 73.7 | 75.5 | 0.4% |
| Micropolitan areas* | 50.1 | 52.4 | 0.7% |
| Rural areas* | 43.1 | 45.1 | 0.7% |
* Based on 2023 CBSA status
This table shows the forecasted 2026-2031 Diversity Index annual change by regional geography:
| Geography | Update 2026 | Update 2031 | Annual change percent |
|---|---|---|---|
| U.S. | 73.0 | 74.6 | 0.4% |
| Midwest | 54.2 | 56.1 | 0.7% |
| Northeast | 69.1 | 70.9 | 0.5% |
| South | 74.5 | 76.0 | 0.4% |
| West | 81.4 | 82.3 | 0.2% |
| Metropolitan areas* | 75.5 | 76.9 | 0.4% |
| Micropolitan areas* | 52.4 | 54.4 | 0.7% |
| Rural areas* | 45.1 | 47.0 | 0.8% |
* Based on 2023 CBSA status
Definition of Diversity Index
The Diversity Index from Esri represents the likelihood that two persons, chosen at random from the same area, belong to different races or ethnic groups. Ethnic diversity, as well as racial diversity, is included in Esri's definition of the Diversity Index. Esri's diversity calculations accommodate up to seven race groups: six single-race groups (White, Black, American Indian, Asian, Pacific Islander, Some Other Race) and one multiple-race group (two or more races). Each race group is divided into two ethnic origins, Hispanic and non-Hispanic. If an area is ethnically diverse, diversity is compounded. The Diversity Index is available down to the block group-level geography.
Esri's definition of diversity is two-dimensional and combines racial diversity with ethnic diversity. This measure shows the likelihood that two people, chosen at random from the same area, belong to different races or ethnic groups. If an area's entire population belongs to one race group and one ethnic group, an area has zero diversity. The Diversity Index is a continuum that ranges from 0 (no diversity) to 100 (complete diversity), where an area's index tends toward 100 when the population is more evenly divided across race and ethnic groups. If an area's entire population is divided evenly into two race groups and one ethnic group, the Diversity Index equals 50. As more race groups are evenly represented in the population, the diversity index increases. Race and Hispanic origin data is reported by the U.S. Census Bureau and other agencies as grouped summary data; therefore, in practice, the Diversity Index will never reach the maximum value of 100.
References
See the following references for additional information:
U.S. Census Bureau Population Estimates Program, Estimates of the Components of Resident Population Change by Race and Hispanic Origin for the United States.
The U.S. Census Bureau implemented changes to the race and ethnicity questions on the 2020 decennial census questionnaire. These consisted of updated wording and new examples for questions related to race and ethnicity. The maximum number of characters allowed for write-in responses increased to 200 characters and multiple race composition increased to a maximum of six categories (from two in the 2010 Census).