Summarize customer demographics
![]() Available with Business Analyst license.
Available with Business Analyst license.
The Generate Customer Demographic Profile Report tool creates an infographic summarizing demographic information to understand characteristics that could be considered common among customers in an area. Customer points are summarized using underlying polygon features (block group by default) and based on the distribution of points (such as customer points), a demographic overview is created.
The purpose of this tool is to summarize the average demographic characteristics of the geographic unit that the points fall into. To use this tool, first add a point layer representing customer locations. A numeric weight field can be entered to weight the average according to the selected field, such as sales. Without using a weight field from the input point data, the final summaries will be weighted using the count of points per geographic unit.
The output is an infographic that summarizes the demographics of the geographies that intersect the input point layer, and an optional feature class output of the polygon features with the point aggregations.
Potential use cases
The following are potential use cases for using the Customer Demographic Profile report to summarize customer demographics:
| Application | Description | Examples of data used |
|---|---|---|
| Analyze customer data to understand the demographic characteristics of top-spending customers. | A retail business creates a report to refine their marketing campaigns and product assortment, and uses the information for site selection. | A layer of customer points containing sales data. |
| Segment customer data based on types of products purchased to inform assortment and marketing strategies. | A local grocery business uses the report to help stay on top of changing trends in consumer behavior and changes in the demographics of their community. | A layer of customer points containing itemized purchasing data. |
| Planning events and outreach | A nonprofit organization creates a report using attendee location information gathered at industry events. This can be used to reach more individuals who have a higher chance of attending future events. | A layer of customer location data from events and other marketing campaigns. |
| Evaluate products, services, and store locations. | A convenience store chain uses the report to create customer profiles that helps the business assess why they perform well or underperform in some markets. | A layer of customer points. |
| Create customer profiles. | A health-care company creates a report based on their current customers to learn how to offer services specific to what their community needs, based on the average population. | A layer of customer points. |
Summarize customer data using a Customer Demographic Profile Report
To summarize a customer dataset by analyzing the demographics of the average customer, do the following:
On the Analysis tab, in the Geoprocessing group, click Tools
 .
.The Geoprocessing pane appears.
On the Toolboxes tab, in the Business Analyst Tools section, expand the Target Marketing toolset and click Generate Customer Demographic Profile Report.
The Generate Customer Demographic Profile Report tool opens in the Geoprocessing pane.
For Input Features, use the drop-down list to select the layer that represents the point features of your customers.
Optionally, under Weight Field, select a field from the drop-down list.
If the customer point layer has a numeric field, such as sales or store visits, this can be used to create the weighted average that is calculated by the tool. For more details, see the Calculations section.
Optionally, under Additional Reports, select additional infographics to create.
By default, the tool creates the Customer Demographic Profile report. To download a report sample, see Reports.
Tip:
When creating additional reports, keep in mind that this tool's calculations may affect variable values, such as total counts, and could be misleading or incorrect.
Set the format and location for the reports:
Under Report Output Formats, select one or multiple of the following options for the infographic output: PDF, HTML, or XLSX.
Use the Output Folder parameter to select the location where the infographic reports will be saved.
Use the Geography Level parameter to change the geography level used for the demographic summary.
U.S. data sources use block groups by default. These polygons are used in the join and final calculation of the report. Smaller standard geography features, such as block groups, can be used for hyper-local analysis on more focused groups of customer data, such as understanding the customer base of a store in the Minneapolis area. Larger standard geography features, such as counties or CBSAs, can be used to summarize customer datasets on a national level.
Note:
If the number of standard geographies exceeds 5,000 features when summarizing the customer dataset, the tool displays a warning message instructing you to select a less detailed level of geography. For example, if the default block group level results in more than 5,000 features, select either ZIP codes or counties.
Optionally, select a location under Output Feature Class to determine where to save the output layer of polygon features containing customer point aggregations.
When one customer input layer is used, the output layer contains symbolized geographies for all intersecting customer points. The output layer also contains Join_Count, Sum (Input), and Sum (Comparison) fields. These fields reflect the total count in each polygon feature based on the intersecting customer points.
Optionally, expand the Comparison Options section to add another customer point layer in the Comparison Features parameter. For more details, see the Comparison options section.
Optionally, add report and infographic options:
Expand the Report Header Options section to add a report title and subtitle on the infographic output.
Expand the Infographic Options section and use the check boxes to add an infographic header, footer, and data source, if not already on the template being used.
Click Run
 .
.The map populates with a layer showing the customer data summarized into the polygon features you selected.
An infographic (or multiple reports you selected in step 5) is saved in the location specified in the Output Folder parameter.
Comparison options
This tool provides the option to run a comparison of two customer datasets. An additional customer dataset can be added to the Comparison Features parameter. The final infographic output will open by default in comparison mode to show the two different summarized customer layers and the demographic calculations. To download a report sample that includes comparison options, see Reports.
When two different customer layers are used—one in the Input Features parameter and the other in the Comparison Features parameter—bivariate symbology will be applied to the output layer based on the count or weighted value (if a weight field is used) from the customer datasets.
You can use the Comparison Weight Field drop-down list to select a numeric field from the customer dataset to create the weighted averages that are calculated in the demographic report.
This functionality can be used to compare customers from different stores, different customer spending levels, or customers who have purchased different products.
Calculations
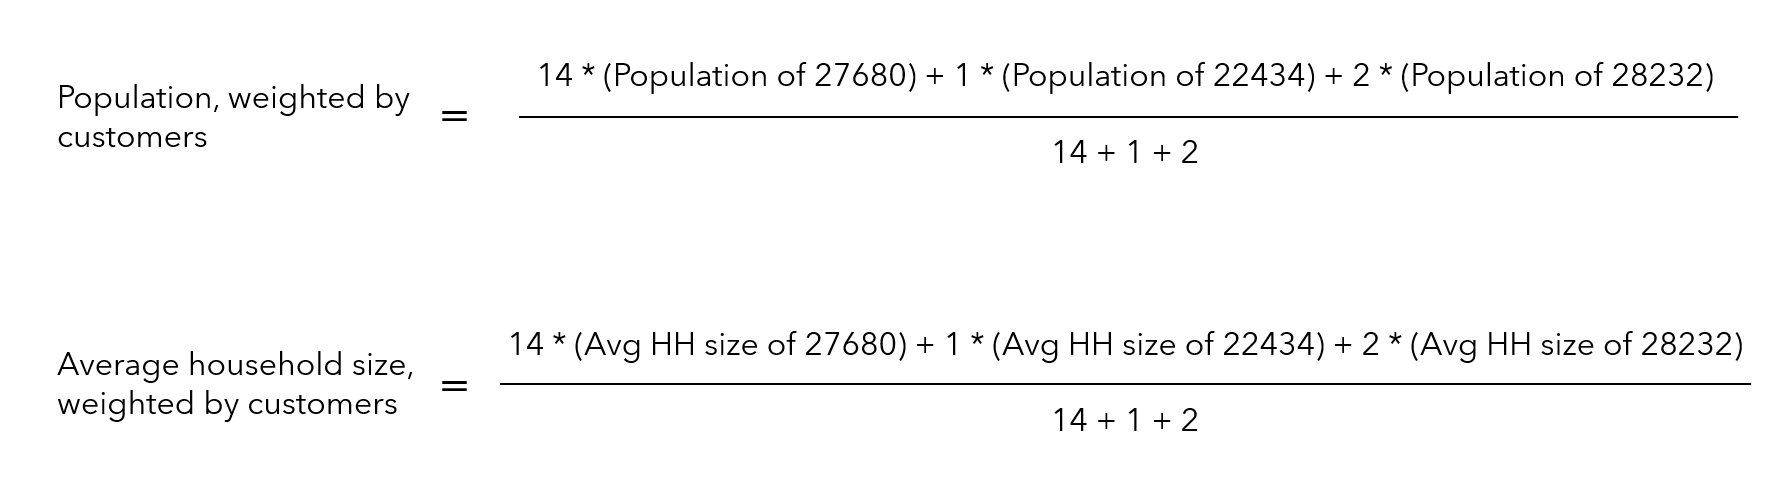
The Generate Customer Demographic Profile tool is unique in how the variable values are calculated in the final infographic report. By default, the tool uses the count of customers in each polygon feature to weight the final average variable value. This weighted calculation is used to obtain the average value of the demographic variables being summarized, with greater weight on areas that contain more of your customer base. This way, the tool creates a customer profile that reflects your customers, rather than the more general average values for each polygon.
In the image below, the points represent a customer base spanning three ZIP codes.

There are 14 customers in ZIP code 27680; 1 customer in ZIP code 22434; and 2 customers in ZIP code 28232. These customer counts will be used to weight the average variable values in the tool's calculations.
However, you may want to weight your customer profile differently. For example, you can use sales or customer spending to understand the demographic profile of your top-spending customers. Without using a weight field, the tool will weight the profile based on the count of customers per polygon feature, as in the example above. If a weight field is used, that value will be used instead of the total count of customers in each polygon.
For example, if you decided to weight the calculations by the number of store visits in each ZIP code, the tool would use the number of visits rather than the number of customer points in the calculation. In the calculation below, there are 17 store visits in ZIP code 27680; 8 store visits in ZIP code 22434; and 4 store visits in ZIP code 28232. These numbers will be used to weight the average variable values in the tool's calculations.

Reports
This tool creates a Customer Demographic Profile report, which summarizes customer demographics for a selected area.
Customer Demographic Profile Report (sample)
To use this report with the U.S. 2025 dataset, follow the instructions below:
- How To: Add and configure Customer Demographic Profile Report template for the local U.S. 2025 Business Analyst dataset in ArcGIS Pro (Knowledge Base article)
Geoprocessing tool
This page describes the functionality of the Generate Customer Demographic Profile Report tool. You can also use this tool to build and run queries through a Python script or model.
This tool is also part of the functionality of the target marketing workflow. To learn more about target marketing geoprocessing tools, see An overview of the Target Marketing toolset.