Beeswarm chart
Beeswarm charts allow you to visualize and compare the distributions of one or more numeric or temporal variables. Each feature or record in the dataset is represented by a point along a continuous value axis. Points with similar values are displaced perpendicular to the axis to prevent overlap, forming a swarm that widens where values are more concentrated.
Beeswarm charts show both the overall shape of a distribution and the individual observations that make up the distribution. This makes it possible to identify patterns such as clusters, gaps, and outliers. Because each observation is displayed as a separate point, beeswarm charts are best suited to small and moderately sized datasets.
Variables
A swarm is drawn for each Number or Date field, allowing distributions to be compared across fields.
When a single Number or Date variable is used, you can add a Category variable to create a swarm for each unique category value and compare distributions across categories.
Note:
When multiple variables are added, they should be the same data type. Numeric and date variables should not be combined in the same chart because their different value scales do not allow for meaningful comparison.
Standardize values
When multiple numeric variables are compared in the same chart, z-score standardization is applied by default. Standardization allows numeric variables of different units to be comparable.
For example, comparing income values (in the tens of thousands) and unemployment rate values (between 0 and 1.0) in one chart would be difficult without standardization because the unemployment values are much smaller in magnitude.
Standardization uses a z-transform in which the mean is subtracted from each value and the result is divided by the standard deviation. This puts all variables on a common scale so multiple distributions can be interpreted together. To visualize raw values instead, uncheck Standardize values (z-score) in the Chart Properties pane.
Normalize amplitude
Normalize amplitude gives all swarms the same maximum width, making it easier to compare distribution shapes regardless of the number of observations. When amplitude is not normalized, swarm width is proportional to the number of observations, allowing both the shape and relative amount of data to be compared.
Color
Use the Color field to symbolize points based on the values of another numeric field. When a Color field is selected, use the Color scheme drop-down menu to select a color scheme. The color scale uses the global minimum and maximum values across all swarms, ensuring that colors represent the same values when comparing distributions.
When no Color field is selected, points are symbolized using the layer symbology.
Axes
The options described in the subsections below control the axes and related settings.
Note:
Beeswarm charts are rotated by default.
X-axis label character limit
Category labels are truncated at 11 characters by default. When labels are truncated, you can hover over the label to view the full text. To display the entire label text in the chart, increase the label character limit.
Y-axis bounds
Default y-axis bounds are set based on the range of data values represented on the y-axis. Customize these values by providing a new axis bound value. You can set axis bounds to keep the scale of a chart consistent for comparison. Click the Reset button  to revert the axis bound to the default value.
Grid intervals
Configure grid intervals for the y-axis using the Interval control. The default grid interval will be calculated automatically.
Date format
You can format the way an axis displays dates by specifying a pre-defined option or defining a custom format string. For example, you can use M/yy as a custom format string to display dates in a numeric month-year format.
Learn more about date formatting
Number format
You can format the way an axis displays numeric values by specifying a number format category or defining a custom format string. For example, you can use $#,### as a custom format string to display currency values.
Learn more about numeric formatting
Appearance
The options described in the subsections below control the chart appearance and related settings.
Titles and description
The charts and axes default titles are based on the variable names and chart type. These can be edited on the General tab in the Chart Properties pane. You can also provide a value for the Description option, which is a block of text that appears at the bottom of the chart window.
Guides
Guide lines or ranges can be added to charts as a reference or way to highlight significant values. To add a new guide, go to the Guides tab in the Chart Properties pane, click the arrow on the Add guide button, and select one of the following options:
Create fixed value line or range guide—Draw a line or range guide at a fixed location. When this option is selected, provide a value for Value where you want the line to draw. To create a range, provide a to value.
Create data-driven guide—Draw a data-driven guide. When this option is selected, use the Value drop-down list to a select a field whose values will be used to calculate the location of the guide. Select an aggregation option to specify how these values are summarized.
The guide style can be configured using the Line style or Fill color style picker, depending on the guide type. Optionally, add text to the guide by specifying a Label value, and configure the label style by clicking the text swatch adjacent to the input to open the style picker. Data-driven guides always display the guide value (based on the field values and aggregation), and this value will be appended to the end of any text provided for the Label value.
Example
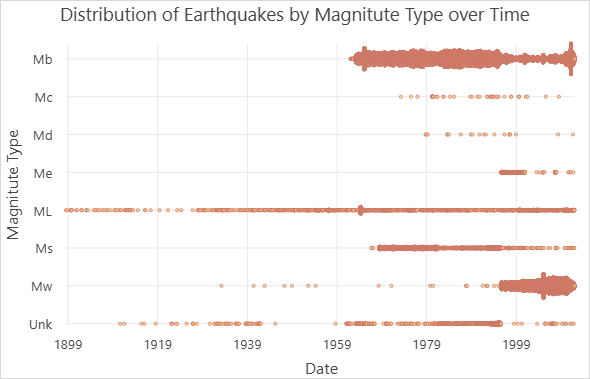
Create a beeswarm chart showing the distribution of earthquakes over time by magnitude type using the following properties:
Number or Date—
DateCategory—
Magnitude TypeNormalize amplitude—unchecked
Each point represents an earthquake, with a separate swarm for each magnitude type. The shape and width of the swarms reveal differences in when and how frequently each magnitude type occurs in the dataset.