Explore Network
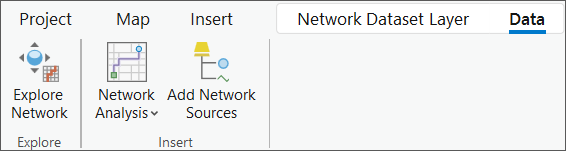
The network elements and attributes of a network dataset layer can be examined using the Explore Network tool on the Data ribbon.
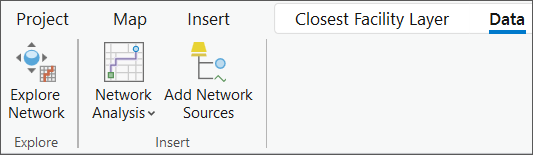
The tool is available on the Data ribbon when a network dataset is added to the map display. The tool is also available when a network analysis layer is created and added to the Contents pane.
Note:
The Explore Network tool is only available when the network data source of the selected network dataset layer is a file geodatabase, a mobile geodatabase, or an enterprise geodatabase. The tool is not available with a service-based network data source.
You can inspect network elements and attributes of a network dataset referenced by a network dataset layer or network analysis layer in the map display using the Explore Network tool. The tool can help identify the following:
What network elements are associated with a source street feature
What other network elements are adjacent to it
The cost to traverse it
Whether its attributes are configured properly to return the expected values
Whether it is restricted by the active travel mode
Explore network window
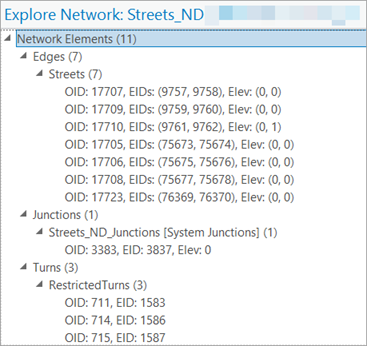
When you activate the Explore Network tool and select an element or multiple elements in a network dataset, the Explore Network window appears. This is a dockable window and is divided into two parts:
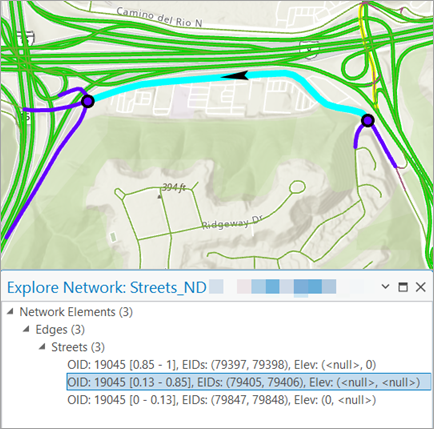
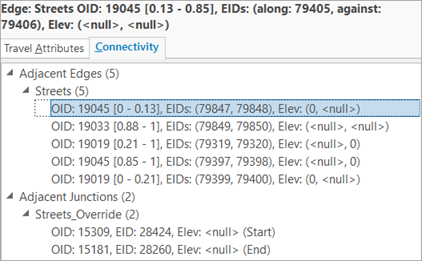
Network Elements—The upper part of the window displays the network elements identified in the map by the Explore Network tool. These are grouped by element type—Edges, Junctions, and Turns. Each element in the elements list is represented by the element ID (EIDs) and the object ID (OID) of its associated source feature. If the network dataset's vertical connectivity policy is elevation fields, the element item header also includes logical elevation values for its endpoints of the associated source feature of each network element. For example, in the highlighted edge below, Elev (0,1) indicates the logical elevation at its from and to ends, respectively.
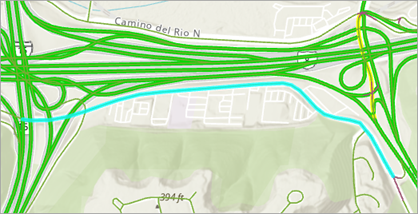
If an edge source uses any vertex group connectivity policy, some edge elements for that source will only cover part of the geometry of their associated source feature geometry. For example, OID: 19045 [0.13 - 0.85], EIDs:(79405,79406) indicates that this edge covers only a portion of its source feature geometry in the range from 13 percent to 85 percent along the edge. The other two edge elements, OID: 19045 [0.85 - 1], EIDs:(79397,79398) and OID: 19045 [0 - 0.13], EIDs:(79847,79848), cover the remaining portion of the source Streets feature with OID: 19045. The example below highlights the source feature that is made of these three edge elements.
Element details—The bottom part of the window is composed of the network element header summary, Travel Attributes subtab, and Connectivity subtab. Together these describe different aspects of the primary selected element.
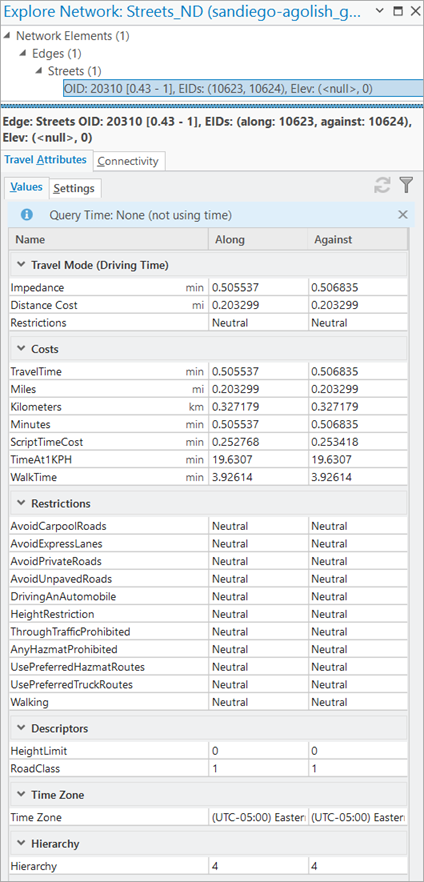
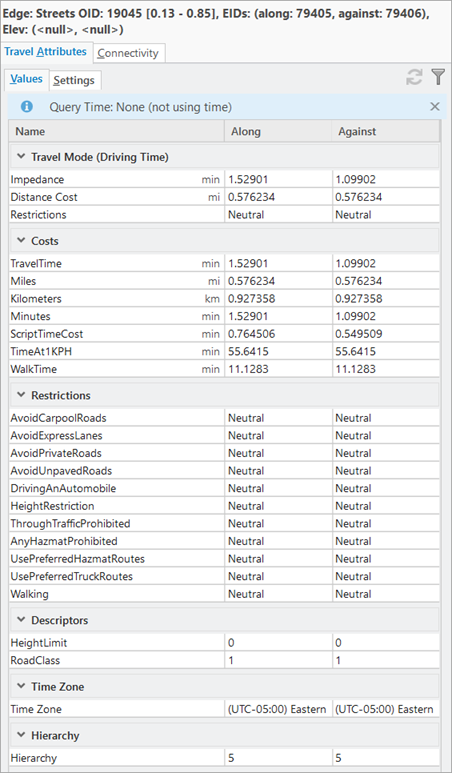
Network element header summary—Displays a summary of the currently selected network element containing the street OID, along and against edge, and any elevation value associated with the edge.
Travel Attributes—This tab is in the lower part of the window and displays the travel attributes associated with the network dataset.
Values—On this tab, for edges, two sets of attributes (one for each direction) are displayed: the name of the attribute, the value along the digitized direction for an edge, and the value against the digitized direction for an edge. For junction and turn elements, the values are reported in a single column because junctions don't have direction and turns are defined in only one direction.
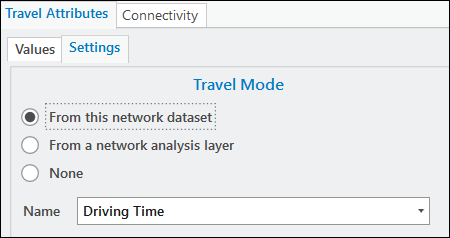
Settings—On this tab, you can specify the source of the travel mode and time query options.
In the Travel Mode section, you can choose the source of your travel mode to come from the network dataset or from a network analysis layer.
From this network dataset—When this option is selected, you can choose the available travel modes defined on the current network dataset, from the Name drop-down list.
From a network analysis layer—When this option is selected as the source, you can choose the network analysis layer from the Layer drop-down list that contains all the network analysis layers in the map that share the same local network data source. The Name option is disabled, and displays the name of the travel mode from the selected network analysis layer.
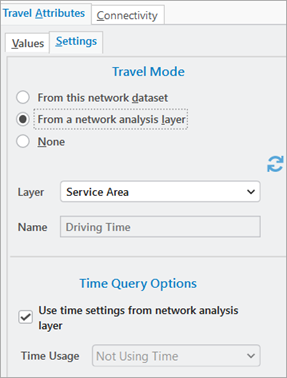
None—Not using a travel mode.
In the Time Query Options section, you can select options from the Time Usage drop-down list to apply query settings to further configure the active network element query used to update the displayed travel attribute values.
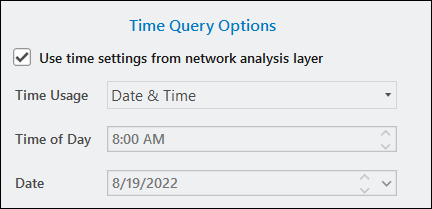
When the travel mode source is this network dataset, the Time Usage is editable unless the travel mode source is a network analysis layer and Use time settings from network analysis layer is checked. Depending on the chosen time usage, additional time query options can also be configured. You can use the time settings of the source network analysis layer to be applied to the query as well. If the source network analysis layer properties relevant to the query are edited in its ribbon or property page, the travel attributes values will automatically be re-queried. However, there can be some cases in which a change in properties of the source network analysis layer travel mode or time settings is not recognized. If this happens, you can explicitly refresh the query settings from the source network analysis layer and force a re-query of the travel attributes with those settings using the Re-query Travel Attribute Values button
 .
.On the Values tab, when you click the Filter Travel Attributes in Travel Mode button
 , only the attributes used by the active travel mode and time query, if specified, will be displayed.
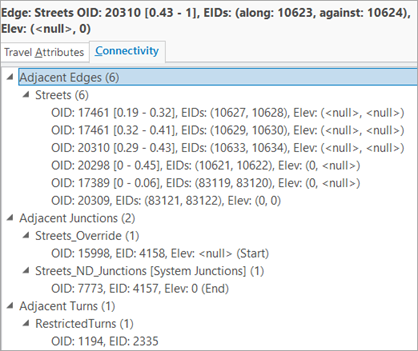
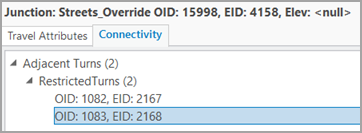
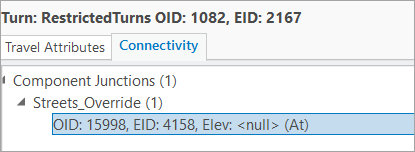
Connectivity—This tab, also in the lower part of the window, displays the connected and adjacent elements.
Identify network elements in the map display
In the table below, the left side shows the elements identified from a network dataset using the Explore Network tool. The Explore Network window, on the right, displays the attributes associated with the identified elements. Learn more about the information that is updated in the Explore Network window based on the selection you make in your map display.
Note:
You can customize default settings for selection tools using the Selection option. You can also customize the highlight color for maps using the Table option.
|
Element |
Explore Network |
|---|---|
|
Edges |
|
|
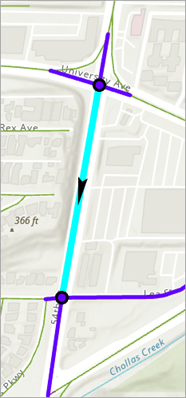
The image shows one of the selected streets.
|
The Travel Attributes tab displays the different travel attributes associated with this street in the Values subtab.
The Connectivity tab shows the adjacent features (Streets, Junctions, and Turns) connected to the selected street. If you double-click an element on the Connectivity tab, it becomes the new primary element.
|
|
|
Select another street. Go to the Travel Attributes tab and switch to the Settings subtab. Make any necessary changes to the Travel Mode or Time Query Options sections. Click the filter button |
|
Junctions |
|
|
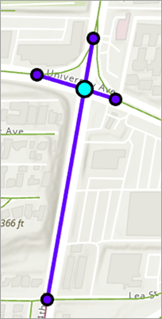
The image shows the selected junction.
|
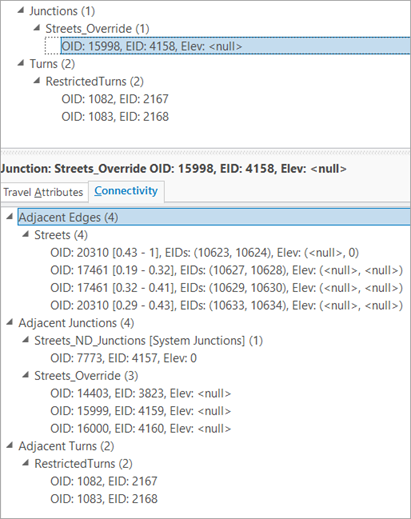
Switch to the Connectivity tab. It displays the other network elements that are connected to the selected junction. In this example, there are five adjacent streets, five adjacent junctions, and an adjacent turn associated with this junction.
|
|
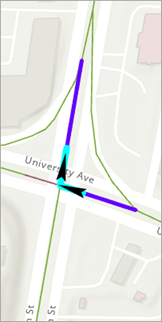
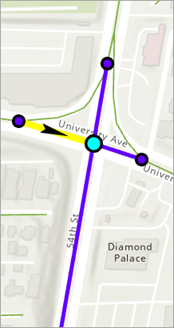
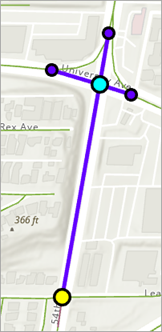
With the same junction still selected, the graphic shows the highlighted adjacent street. The arrow indicates the along direction of the highlighted adjacent edge.
|
|
|
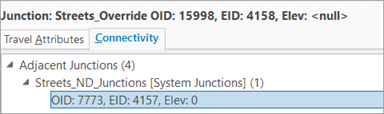
In this image, the highlighted adjacent junction is one of the five adjacent junctions.
|
|
|
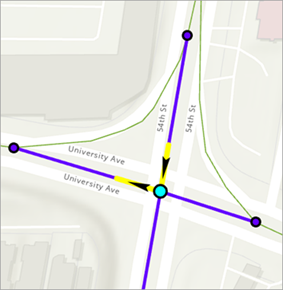
The image shows the adjacent turn.
|
|
|
Turns |
|
|
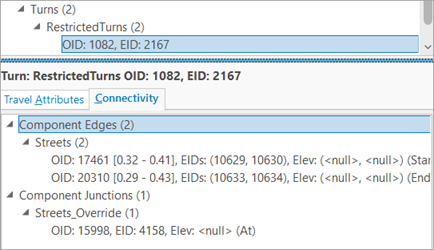
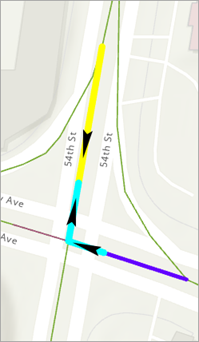
The image shows the selected turn.
|
|
|
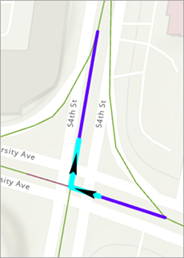
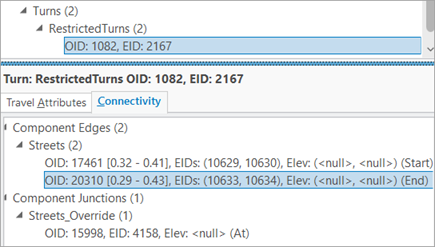
The image shows as highlighted one of the component streets of the turn.
|
|
|
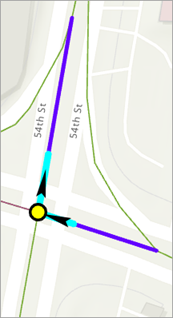
The graphic shows the at junction of the turn.
|
|