Route analysis layer
This topic describes the route analysis layer's feature classes and analysis properties.
Learn more about the route solver
Learn more about network analysis layers
Stops feature class
The Stops feature class initially stores the locations you want the output route or routes to visit. After running the analysis, it stores the locations that were reached by the route, those that weren't (and the reason they weren't reached), and the order in which the stops were visited, as well as other information.
The following tables describe the input fields, input/output fields, and output fields of the Stops feature class:
Stops: Input fields
|
Input field |
Description |
Data type |
|---|---|---|
|
|
The system-managed ID field. |
Object ID |
|
|
The geometry field indicating the geographic location of the network analysis object. |
Geometry |
|
|
The name of the stop. A name, which you can edit, is assigned automatically when the stop is added to the map. |
Text |
|
|
The name of the route to which the stop belongs. Stops with the same Using this field, you can group stops into different routes, and the output attempts to generate one route for each group of stops.
|
Text |
|
|
This field stores the earliest time the stop can be visited. If By default, if the network dataset has a time-zone attribute, the date and time specified in this field refer to the same time zone as the edge, or street, on which the stop is located. If you want the date and time to be interpreted as UTC, change the The time zone for the time window fields can be specified using the |
Date |
|
|
This field stores the latest time the stop can be visited. Together, the If a location has a By default, if the network dataset has a time-zone attribute, the date and time specified in this field refer to the same time zone as the edge, or street, on which the stop is located. If you want the date and time to be interpreted as UTC, change the The time zone for the time window fields can be specified using the |
Date |
|
(for instance, Attr_Minutes, where Minutes is the travel cost) |
This field specifies how much additional time spent or distance traveled will occur at the stop. To determine the units of the field, refer to the units of the network cost attribute specified in the field name. For instance, if there is a A zero or null value indicates the stop requires no service time or extra distance traveled. You may want to add more time on a stop to represent how long it takes to make a delivery, install equipment, or perform some other task at the stop. Similarly, adding extra distance may be useful to account for a long driveway or other road that isn't represented by your network dataset. If you have multiple network cost attributes, you'll see multiple |
Double |
|
|
The
|
Long |
|
|
This field describes the stop type.
|
Long |
Note:
A time window only states when a vehicle can arrive at a stop, not when the Attr_[Cost] must also be completed. To account for service time and leave before the time window is over, subtract Attr_[Cost] from the TimeWindowEnd field.
Stops: Input/output fields
|
Input/output field |
Description |
Data type |
|---|---|---|
|
|
As an input field, this number represents the order in which the stops will be visited. You can use the Sequence parameter on the Route Layer tab to specify whether the output route follows the sequence specified in this field or overrides it to generate an optimal sequence that minimizes backtracking. Within a route (that is, for stops with the same |
Long |
|
|
Specifies the status of the point with respect to its location on the network and the outcome of the analysis. The possible values are the following:
|
Long |
|
Network location fields
|
Together, these properties describe the point on the network where the object is located. |
|
Stops: Output fields
|
Output field |
Description |
Data type |
|---|---|---|
|
|
Indicates which side of the vehicle the curb is on when the vehicle approaches the stop. If the stop's |
Long |
|
|
Indicates which side of the vehicle the curb is on when the vehicle departs the stop. If the network location's |
Long |
|
(for instance, |
This field is the total time, distance, or other travel cost it takes to reach the stop. This includes the travel cost incurred in traveling to the stop, the cost at the stop, and the costs of all the previous stops. If a route analysis layer determines it takes 10 minutes to visit two stops, and the second stop has an |
Double |
|
(for instance, |
This field stores the time spent waiting for the time window to open ( |
Double |
|
(for instance, |
This field stores a sum of how much time has been spent waiting for time windows to open ( |
Double |
|
|
This field is a measure of how late the route arrived after the time window closed ( |
Double |
|
|
This field stores the cumulative violation time ( |
Double |
|
|
The date and time value indicating the arrival time at the stop. When using traffic data that covers multiple time zones, the time zone for this time-of-day value is taken from the network element on which the order is located. |
Date |
|
|
The date and time value indicating the departure time from the stop. When using traffic data that covers multiple time zones, the time zone for this time-of-day value is taken from the network element on which the order is located. |
Date |
|
|
The date and time value indicating the arrival time in coordinated universal time (UTC). |
Date |
|
|
The date and time value indicating the departure time in coordinated universal time (UTC). |
Date |
Routes feature class
The Routes feature class stores the resulting route, or routes, from the analysis. It is an output-only class; the route analysis layer overwrites or deletes any route features while running the analysis.
The following table describes the output fields of the Routes feature class:
Routes: Output fields
|
Output field |
Description |
Data type |
|---|---|---|
|
|
The system-managed ID field. |
Object ID |
|
|
The name for the route is assigned automatically when the route layer is solved, either by reading the value from the |
Text |
|
|
The geometry field indicating the geographic location of the network analysis object. |
Geometry |
|
|
The |
Long |
|
|
The |
Long |
|
|
The number of stops visited by the route. |
Long |
|
(for instance, |
The total distance, time, or other travel cost from the beginning of the first stop to the end of the last stop. The total travel cost and the |
Double |
|
(for example, |
This field stores the route's overall wait time, which is the time spent at stops waiting for time windows to open. |
Double |
|
(for example, |
This field stores the route's overall violation time at stops. Violation time is added when the route arrives at a stop after the time window has ended; it's the difference between the |
Double |
|
|
The time the route begins. |
Date |
|
|
The time the route is complete. |
Date |
|
|
The start time of the route in coordinated universal time (UTC). |
Date |
|
|
The end time of the route in coordinated universal time (UTC). |
Date |
Route analysis layer properties
The following subsections list properties you can set on the route analysis layer. They are found on the Route Layer tab, which is available only if your route layer or one of its sublayers is selected in the Contents pane.
Analysis
Use the options in this section to estimate the credits and run the analysis.

Run
Once you load input features and set analysis properties, click the Run button to run the analysis. If the analysis uses credits, and the number of credits estimated for the solve exceeds the available credits, an error message appears that blocks the solve or a warning message that allows you to choose whether to proceed with the solve.
The run button may appear different based on the source of the network dataset.
 —The network analysis layer is referencing a local network data source.
 —The network analysis layer is referencing a network data source in ArcGIS Online.
 —The network analysis layer is referencing a network data source in an ArcGIS Enterprise portal.
Estimate Credits
You can use the Estimate Credits button to estimate the number of service credits that will be consumed by running the analysis on the selected network analysis layer. When this button is enabled, it indicates that the network analysis layer will consume credits when solved.

The Estimate Credits button is enabled when the following occur:
The network analysis layer's network data source is hosted in ArcGIS Online.
Your ArcGIS Enterprise portal routing services are configured from ArcGIS Online.

The Estimate Credits button is disabled when the following occur:
The network analysis layer's network data source is stored on a local machine.
You're using your own services published on your ArcGIS Enterprise portal.
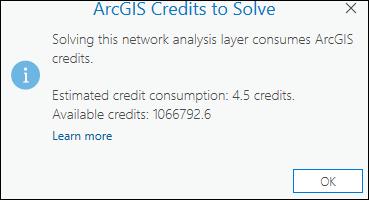
When you click the Estimate Credits button, a dialog box appears with an estimate of the number of credits that are likely to be consumed solving the current analysis. The credit estimate is based on the number of input locations used in the analysis. The actual credits consumed may change based on the output generated by the Solve operation. Depending on how your organization has set up the credit budgeting and allocation settings, the available credits may not be shown. Also, credit estimation may not always be possible if the network data source is an ArcGIS Enterprise portal with routing services configured from ArcGIS Online.
Learn more about the credit usage by each analysis type
Note:
Depending on the configuration of the ArcGIS Online organization account and the signed-in user, solving the analysis may be blocked or may show a warning if the estimated credits exceed the available credits.
Input Data
Use the options in this section to import the input features to participate in the analysis.
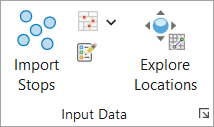
Import Stops
Use Import Stops ![]() to load features from another data source, such as a point feature layer, into the Stops feature class.
to load features from another data source, such as a point feature layer, into the Stops feature class.
Import Barriers
Use the Import Point Barriers ![]() , Import Line Barriers
, Import Line Barriers ![]() , or Import Polygon Barriers buttons
, or Import Polygon Barriers buttons ![]() to load features from another data source, such as another feature layer, into one of the barriers feature classes (point barriers, line barriers, or polygon barriers).
to load features from another data source, such as another feature layer, into one of the barriers feature classes (point barriers, line barriers, or polygon barriers).
Create Features
Use the Create Features button ![]() to open the Create Features pane. Select from the available templates to create features in the current map.
to open the Create Features pane. Select from the available templates to create features in the current map.
Explore Locations
The Explore Locations tool helps to visualize on the map where an input point was located on the network or if not located at all.
Learn more about Explore Locations
Travel Settings
Use the options in the Travel Settings section to select the travel mode and optimize the route.
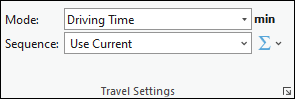
Mode
Use the Mode drop-down list to choose a travel mode, which is a group of settings that together model the movement of pedestrians, cars, trucks, or other travel mode. The choices available in the drop-down list depend on the travel modes that are configured on the network data source that the network analysis layer is referencing.
Sequence
The Route solver always finds the shortest path between two stops. However, you can potentially shorten the overall route by calculating the best stop sequence that minimizes backtracking. Optimizing stop order is also known as TSP.
Sequence gives you the following options to preserve all, some, or none of the stop sequences:
Use Current
 —Preserves the relative stop order specified in the
 Sequencefield of the stops.Any stops having null
Sequencefield values are inserted after those with non-null values.Find Best
 —Does not preserve the sequence of any stops, which means the route can begin at any stop location. All stops are reordered to find the shortest possible route.
Preserve First & Last Stop
 —The route starts and ends at the first and last stop, respectively. The intermediate stops are reordered to find the shortest possible route.
If the input stops have a mix of null and non-null
Sequencefield values, the route begins at the stop with the lowest non-null value and ends at the last stop in the feature class that has a null value.Preserve First Stop
 —The route starts at the first stop. The subsequent stops are reordered to find the shortest possible route.
If the input stops have a mix of null and non-null
Sequencefield values, the route begins at the stop with the lowest non-null value and continues to the other stops, which are optimally reordered regardless of whether they have null or non-null values.Preserve Last Stop
 —The route ends at the last stop. The preceding stops are reordered to find the shortest possible route.
If the input stops have a mix of null and non-null
Sequencefield values, the route ends at the last stop in the feature class that has a null value. All preceding stops are reordered for optimality regardless of whether they have null or non-null values.
Accumulate Cost Attributes
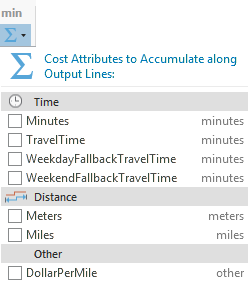
The Accumulate Cost Attributes drop-down menu  can be used to configure accumulated cost attributes. The drop-down menu is unavailable if the network data source is a service, the output geometry types do not include lines, or there are no cost attributes. The attributes are grouped by unit domain shown as the group header (for example, Time or Distance). A checked check box indicates that the analysis layer will accumulate the checked attribute during the solve.
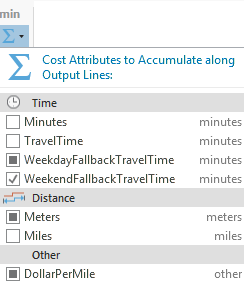
When multiple analysis layers of the same layer type are selected, the check box shows a mixed state if all layers do not share the same checked status for one attribute. In the following image, the WeekendFallbackTravelTime attribute is selected for multiple layers, so it has a check mark:
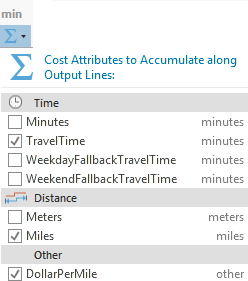
If all selected layers share the checked status for an attribute, the check box shows that state:
Date and Time
Use the options from the Date and Time section to specify the date, time, and day to be used in the analysis.
Learn more about date and time
Arrive Depart Date-Time Type
The Arrive Depart Date-Time Type drop-down list is available when the cost units are time based. From the drop-down list, choose whether a specific time and date value is given to indicate the time that the route or routes depart from their first stop. The primary reason for setting a specific time and date is to solve the analysis using dynamic traffic conditions or public transit schedules; however, to use traffic or public transit in the analysis, the network dataset or route service must include traffic data or public transit.
The options in the drop-down list are as follows:
Not Using Time—Regardless of whether the network data source includes time-based data, the results are based on static travel times—the travel times on a network edge don't vary throughout the day. The Time of Day and Date text boxes are unavailable.
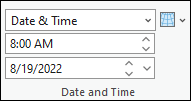
Date & Time—Specify the time as a time of day and calendar date. The Time of Day and Date text boxes are available to provide this information.
Day of Week—Specify a time of day and day of the week. The Time of Day and Date text boxes are available to provide this information.
Today—Specify a time, and the day is assumed to be the current date. The Time of Day text box is available to provide the time of day, and the Date text box is set to Today and is unavailable so it can't be changed.
Now—When you run the analysis, the time and date are set to the current time and date. This is useful if the network dataset is configured with live traffic data, and the routes are distributed to drivers for implementing immediately after running the analysis. The Time of Day and the Date text boxes are unavailable so they can't be changed.
Time of Day
Specify the depart time of the day.
See the Arrive Depart Date-Time Type section to see when this option is enabled.
Date
Specify the depart day of the week by typing one of the following values in the Date text box:
Monday
Tuesday
Wednesday
Thursday
Friday
Saturday
Sunday
See the Arrive Depart Date-Time Type section to see when this option is enabled.
Reference Time Zone
From the Reference Time Zone drop-down list  , you can choose the time zone to use in the analysis. The options are as follows:
Local Time at Locations
Coordinated Universal Time (UTC)
Output Geometry
Use the options from the drop-down menu to choose how the output will display in the map.
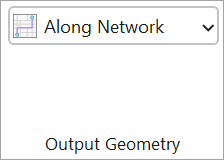
Output Geometry Linear Shape Type
The route analysis always solves least-cost paths along the network using the settings you specify, but in addition to displaying these true paths along the network on the map, you can also represent the routes on a map using simple straight lines between stops or no lines at all.
No Lines—No output linear shapes are generated.
Straight Lines—Output simplified geometry as straight lines.
Along Network—Generate true paths along the network on the map.
Drawing
Use the Symbology button ![]() to access the symbology pane for the active network analysis layer. You can configure the symbology for the sublayers of the active network analysis layer by choosing one of the following options:
to access the symbology pane for the active network analysis layer. You can configure the symbology for the sublayers of the active network analysis layer by choosing one of the following options:
Single Color—This option is available for all network analysis layer types. All feature sublayers in the active network analysis layer except barriers will use the same single symbol with the specified color. For example, choosing a single color of blue for a Route layer will convert all the Stops and Routes features to the same color of blue.
Color Linked—This option is available for Route, Last Mile Delivery, Vehicle Routing Problem, and Waste Collection analysis layers. It applies a color scheme to the sublayers such that related features are symbolized with the same color. This symbology configuration symbolizes related features with the same color, making it easier to visually distinguish different routes and their associated features in the map. For example, for a Route layer with multiple routes, each route and the stops assigned to that route will be assigned matching colors.
Learn more about network analysis layer symbology
Filtering
You can filter the network analysis sublayers to only show features related to the selected features in the primary layer.

Add Filters
 —Applies filters to sublayers of the network analysis layer to only show features related to the selected feature of the primary sublayer. Definition queries are automatically created and applied on the relevant sublayers. Every time the Add Filters button is clicked, a new definition query is created with the same name replacing the previous definition query.
When a feature is selected in the primary sublayer Routes, a definition query called Route is created on the Routes sublayer (primary layer) and the related Stops sublayer.
Remove Filters
 —Deletes the definition query on the primary and the related sublayers.
Directions
Use the options from the Directions section to specify whether directions should be generated.
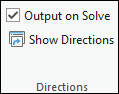
Output on Solve
Turn on this option to generate directions upon solve for the current network analysis layer.
Show Directions
When the Output on Solve option is checked, when you click the Show Directions button ![]() , the Directions pane appears with turn-by-turn directions for each route in the solution.
, the Directions pane appears with turn-by-turn directions for each route in the solution.
Share As
Share the output of the analysis by using the available option of Route Layers.

Share as Route Layers
Use the Route Layers button ![]() to share the results from the analysis as route layers. This button opens the Share as Route Layers geoprocessing tool. After it runs, the results from the analysis are shared as route layer items in the portal.
to share the results from the analysis as route layers. This button opens the Share as Route Layers geoprocessing tool. After it runs, the results from the analysis are shared as route layer items in the portal.