Create a template for an LRS length data product
 Available with the Linear Referencing license.
You can use the Data Product Designer wizard to create a template for a linear referencing system (LRS) length data product.
An LRS length data product is used to calculate the length of routes based on their characteristics. The following table is an example of an LRS length data product that computes length of pipes in different materials summarized by line name:
Summary field: Pipeline Name
Length fields: Steel, Plastic, Cast/Wrought Iron, Ductile Iron, Copper, and Other
| Pipeline Name | Steel | Plastic | Cast/Wrought Iron | Ductile Iron | Copper | Other |
|---|---|---|---|---|---|---|
| Dripping Springs to Smithville | 57685.399 | 2782.144 | 30466.520 | 105.835 | 5313.148 | 205.972 |
| Smithville to San Antonio Pressure System | 38100.377 | 2774.152 | 30084.713 | 106.712 | 5506.429 | 112.218 |
| Smithville to Houston National | 68750.141 | 2778.091 | 30152.803 | 113.810 | 5763.907 | 171.440 |
| Houston National to West Montgomery | 9891.025 | 1013.462 | 20014.545 | 69.013 | 2275.384 | 26.855 |
| Toboso Flat to Wink | 22570.633 | 1662.397 | 23085.910 | 182.339 | 3350.644 | 55.359 |
| Wink to Crane | 8810.257 | 792.611 | 19934.529 | 103.849 | 4029.958 | 104.295 |
| Crane to Puckett | 49052.482 | 1093.583 | 29883.968 | 99.403 | 2938.018 | 105.951 |
| Puckett to Middle Valley | 84739.194 | 2119.244 | 41182.485 | 205.975 | 6391.573 | 322.594 |
| Turner to Brandenberger 66 Ranch | 9295.227 | 598.028 | 18493.245 | 38.996 | 1998.912 | 56.421 |
| Gathering Backbone Line | 49672.684 | 2649.184 | 26583.385 | 139.586 | 5999.484 | 189.400 |
Other types of LRS length data products that you can configure include the following:
Length of types of pipe systems, such as on-shore transmission, on-shore gathering, and so on, summarized by installation year
Length of leak report summarized by pipeline name and status code
Length of categories of pipe diameters and pipe materials summarized by pipe systems
An LRS length data product is used to calculate the length of routes based on their characteristics. The following table is an example of an LRS length data product that computes mileage of urban roads and rural roads summarized by counties and pavement conditions.
Summary fields: County and Pavement
Length fields: Urban Roads and Rural Roads
|
County |
Pavement |
Urban Roads |
Rural Roads |
|---|---|---|---|
|
Crawford |
Paved |
235.533 |
13.852 |
|
Unpaved |
6.029 |
5.487 |
|
|
Dubois |
Paved |
44.496 |
122.724 |
|
Unpaved |
13.153 |
55.692 |
|
|
Harrison |
Paved |
104.002 |
82.520 |
|
Unpaved |
19.638 |
46.776 |
|
|
Pike |
Paved |
633.968 |
34.25 |
|
Unpaved |
41.576 |
3.040 |
|
|
Perry |
Paved |
260.674 |
0.000 |
|
Unpaved |
20.030 |
0.016 |
|
|
Spencer |
Paved |
103.373 |
1.031 |
|
Unpaved |
9.655 |
0.000 |
|
|
Warrick |
Paved |
422.927 |
208.069 |
|
Unpaved |
55.608 |
102.700 |
Other types of LRS length data products that you can configure include the following:
Mileage of types of road surfaces, such as bitumen, asphalt, gravel, concrete, and so on, summarized by functional class
Mileage of maintained public roads in each county, summarized by jurisdiction
Lane miles and daily Vehicle Miles Traveled (VMT) by urban area
In this workflow, you'll learn how to create a template to produce an LRS length data product similar to the one shown in the table above.
Choose an LRS data product type
The first step in the Data Product Designer wizard is to specify the data product type.
To specify the length data product type, complete the following steps:
Start ArcGIS Pro and open a project with LRS data in the map.
On the Linear Referencing tab, in the Data Products group, click Data Product Designer
 .
The Choose an LRS data product type page of the Data Product Designer wizard appears, and the default Data Product Type value is Length.
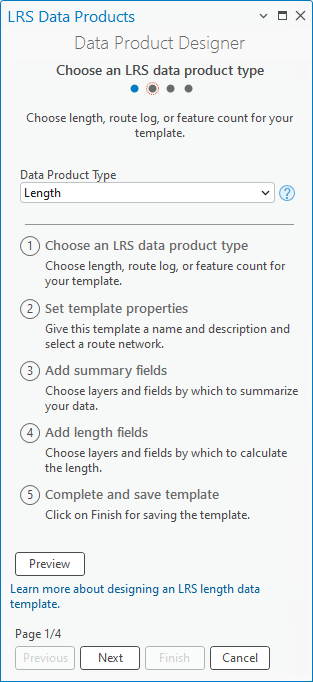
Click Next.
The Set template properties page appears.
Set template properties
To set the template properties, complete the following steps:
Provide a template name.
By default, the template is saved in the project folder. Optionally, browse to a different location, provide a name for the template, and click OK.
Click the Network drop-down arrow and choose a network.
This network is used to calculate the length of the routes.
This network is used to calculate the length of the roads.
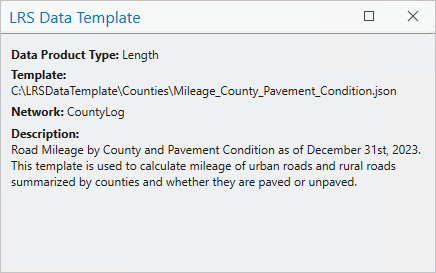
Optionally, provide a description.
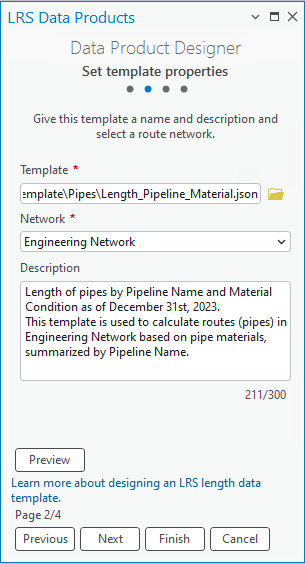
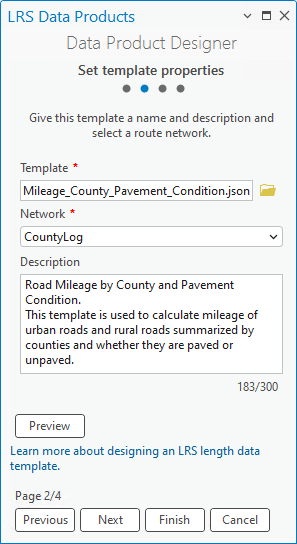
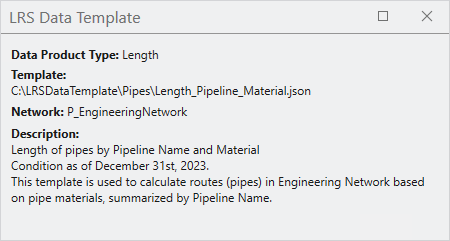
Optionally, click Preview to open the canvas.
The canvas formats the information provided in the Data Product Designer wizard.
Click Next.
Add summary fields
The next step in producing the LRS data template is to select a summary layer and summary fields. The LRS length data product is summarized based on unique values in the summary layer. You can configure multiple summary layers and summary fields. The summary layers are arranged and divided by levels based on their spatial relationships.
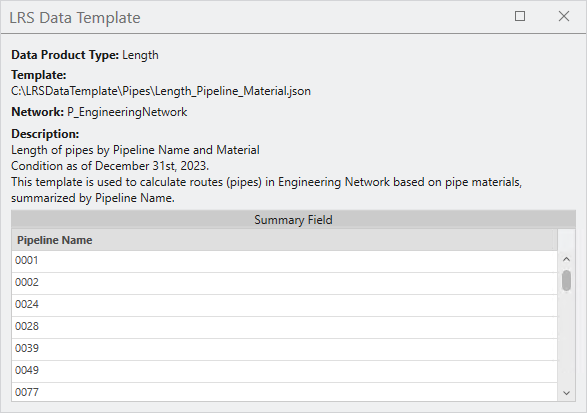
For this example, you can configure a pipe system layer as level one, and a pipeline layer as level two. The LRS length data product summarizes the length of each pipeline in each pipe system.
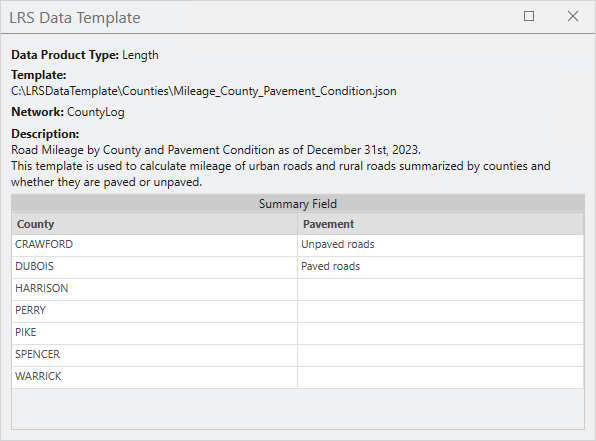
For this example, you can configure a county boundary layer as level one, and a pavement condition layer as level two. The LRS length data product summarizes the length of paved and unpaved roads in each county.
Note:
This step in the process is optional. If you don't want to add summary fields to the template, click Next to proceed.
To set the template summary fields, complete the following steps:
Click Add to add a summary level.
Click the Summary Layer drop-down arrow and choose a summary layer.
This layer can be a polygon feature class, a line event registered to the network specified in the second page, or the network itself. This layer must be in the same geodatabase or feature service and have the same coordinate system as the specified network.
For this example, Engineering Network is the summary layer for the first level.
Click the Field drop-down arrow and choose a summary field.
For this example,
Line Nameis the summary field for the Engineering Network layer.After you choose a summary field, the Display Value Map section shows the unique values in the summary field. You can edit the Display Value column in the table. The LRS length data product only calculates route length for values in the Display Value Map section.

Provide a name for the summary level in the Name in Table text box.
For this example, the level name is Pipeline Name.
Optionally, click the Filter Expression drop-down arrow and provide an expression to filter display values in the Display Value Map section.
For this example, the pipelines that are gathering field pipes are chosen. Only the length of the routes in these pipelines will be calculated.

Optionally, check the Summarize unclassified values check box to summarize length that is not included by the values in the Display Value Map.
The summary field returns an additional value, Unclassified.
By default, the Summarize unclassified values check box is not checked. This check box applies to all summary layers.
For this example, the Summarize unclassified values check box remains not checked.
If you're adding multiple summary levels, repeat the previous steps for each level.
Click Next.
Click Add to add a summary level.
Click the Summary Layer drop-down arrow and choose a summary layer.
This layer can be a polygon feature class, a line event registered to the network specified in the second page, or the network itself. This layer must be in the same geodatabase or feature service and have the same coordinate system as the specified network.
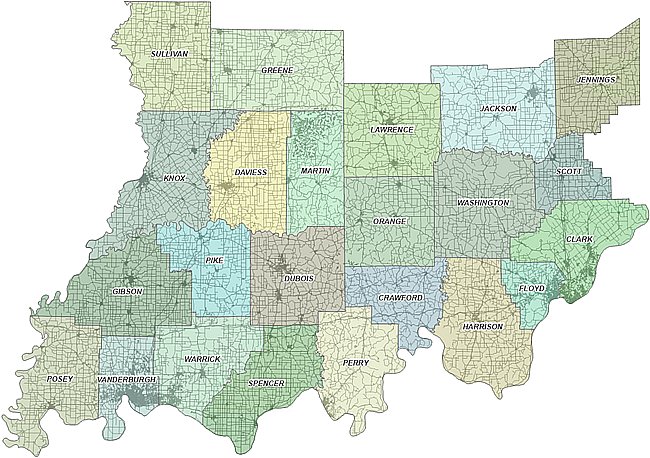
For this example, County Boundary is the summary layer for the first level.
Click the Field drop-down arrow and choose a summary field.
For this example,
County Nameis the summary field for the County Boundary layer.After you choose a summary field, the Display Value Map section shows the unique values in the summary field. You can edit the Display Value column in the table. The LRS length data product only calculates road length for values in the Display Value Map section.

Provide a name for the summary level in the Name in Table text box.
For this example, the level name is County.
Optionally, click the Filter Expression drop-down arrow and provide an expression to filter display values in the Display Value Map section.
For this example, the seven counties that belong to the Southeast category are chosen. Only the length of the roads that are clipped by these seven counties are calculated.


Optionally, check the Summarize unclassified values check box to summarize length that is not included by the values in the Display Value Map.
The summary field returns an additional value, Unclassified.
By default, the Summarize unclassified values check box is not checked. This check box applies to all summary layers.
For this example, the Summarize unclassified values check box remains not checked.
If you're adding multiple summary levels, repeat the previous steps for each level.
For this example, Pavement Condition is the summary layer for the second level,
PSRis the summary field, and Pavement is the second level name. A filter applied to PSR generates two display values: Paved and Unpaved roads.As a result, the LRS length data product summarizes the length of paved and unpaved roads in each county.

Click Next.
Add length fields
After you select the summary layer, the next step is to add the length fields. The length fields form the columns that show the length of routes in the LRS length data product.
After you select the summary layer, the next step is to add the length fields. The length fields form the columns that show the length of roads in the LRS length data product.
The options for configuring length fields are Single Value and Unique Values. You can configure length fields one by one using the Single Value option and applying a filter to create categories, or you can use the Unique Values option to configure all the unique values needed as individual length fields.
This example uses Single Value to calculate the length of pipes in different materials because the data has more than one unique value that combines into one category. For example, the Steel field is a composite of the Bare Steel and Coated Steel fields. You'll configure them as one length field instead of individual fields.
This example uses Single Value to calculate the mileage of urban and rural roads because the data has four unique values that you can configure as two fields instead of four.
To set template length fields, complete the following steps:
Click Add to add a length field.
Click the Length Layer drop-down arrow and choose a length layer.
This layer can be a line event registered to the network specified in the second page, or the network itself. This layer must be in the same geodatabase or feature service and have the same coordinate system as the specified network.
For this example, line event Gathering Field Pipe is the first length layer.
Click the Selection Method drop-down arrow and choose a selection method.
Single Value—Add a single length field.
Unique Values—Add multiple unique values for a selected length field, and each unique value becomes an individual field. This option only appears when a length layer is provided without a name or filter.
If you chose Single Value, skip step 4 below. For this example, Single Value is used as the selection method with customized filters applied to the length field and the example continues at step 5 below.
If you chose Unique Values, choose a field in the length layer from the pop-up window that appears and do the following:
Choose the unique values by clicking the check boxes next to the values.
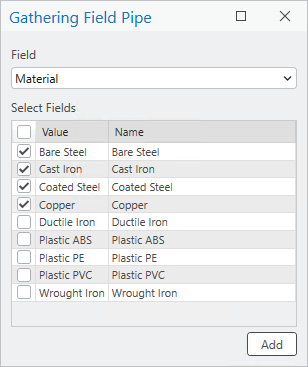
Optionally, change the name for each selected unique value.
The name becomes the name for the length field when the unique values are added to the Data Product Designer wizard.
Click Add to add the selected unique values as length fields.
Each length field automatically has Single Value as the selection method, and a filter expression corresponding to the unique values.

Note:
The Unique Values option also honors values in coded value domains and subtypes.
Provide a name for this length field or update the existing names by clicking each cell.
For this example,
Steelis the name for the first length field.Optionally, click the Filter Expression drop-down arrow and provide an expression to filter the length fields.
For this example, because the template is used to calculate length of pipes in different materials, the length fields are the unique values in the
Materialfield. The first length field is namedSteel, and a filter is applied to theMaterialfield to select values that correspond to the steel category, such as bare steel and coated steel.
Optionally, check the Calculate row and column totals check box to calculate the total length value for the rows and columns in the data product.
By default, the Calculate row and column totals check box is not checked. This check box applies to all length layers.
For this example, the Calculate row and column totals check box remains not checked.
If you're adding multiple length fields, repeat the previous steps for each field.
For this example, the additional length fields are Plastic, Cast/Wrought Iron, Ductile Iron, Copper, and Other.

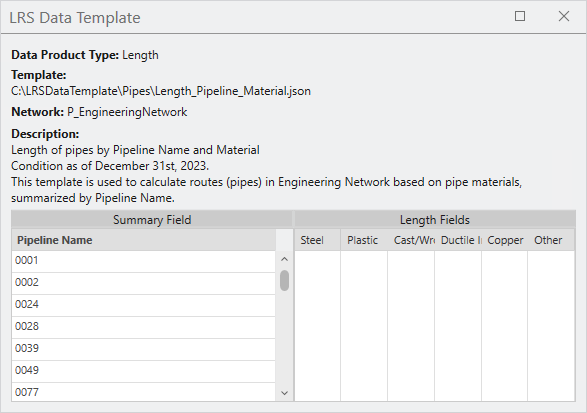
Click Finish to save the template.
Click Add to add a length field.
Click the Length Layer drop-down arrow and choose a length layer.
This layer can be a line event registered to the network specified in the second page, or the network itself. This layer must be in the same geodatabase or feature service and have the same coordinate system as the specified network.
For this example, line event CLEu_RurlUrbn is the first length layer.
Click the Selection Method drop-down arrow and choose a selection method.
Single Value—Add a single length field.
Unique Values—Add multiple unique values for a selected length field, and each unique value becomes an individual field. This option only appears when a length layer is provided without a name or filter.
If you chose Single Value, skip step 4 below. For this example, Single Value is used as the selection method with customized filters applied to the length field and the example continues at step 5 below.
If you chose Unique Values, choose a field in the length layer from the pop-up window that appears and do the following:
Choose the unique values by clicking the check boxes next to the values.
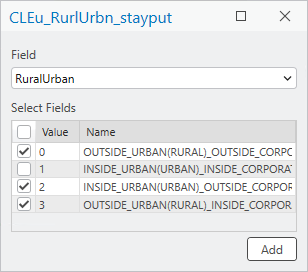
Optionally, change the name for each selected unique value.
The name becomes the name for the length field when the unique values are added to the Data Product Designer wizard.
Click Add to add the selected unique values as length fields.
Each length field automatically has Single Value as the selection method, and a filter expression corresponding to the unique values.

Note:
The Unique Values option also honors values in coded value domains and subtypes.
Provide a name for this length field or update the existing names by clicking each cell.
For this example,
Urban Roadsis the name for the first length field.Optionally, click the Filter Expression drop-down arrow and provide an expression to filter the length fields.
For this example, because the template is used to calculate mileage of urban roads and rural roads, the first length field is named
Urban Roads, and a filter is applied to theRuralUrbanfield to select values that correspond to the urban roads category.
Optionally, check the Calculate row and column totals check box to calculate the total length value for the rows and columns in the data product.
By default, the Calculate row and column totals check box is not checked. This check box applies to all length layers.
For this example, the Calculate row and column totals check box remains not checked.
If you're adding multiple length fields, repeat the previous steps for each field.
For this example, the second length field is called Rural Roads and a filter is applied to the
RuralUrbanfield to select values that correspond to the rural roads category.
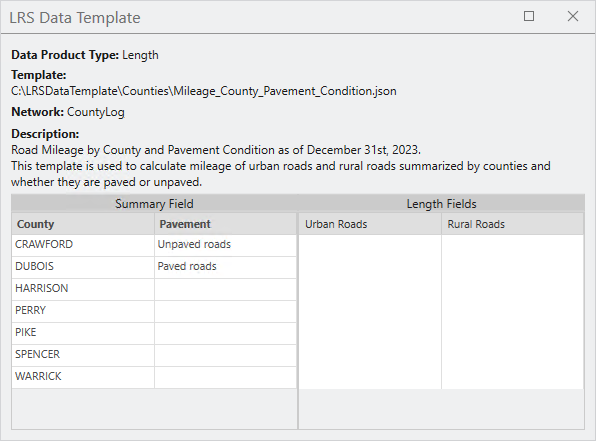
Click Finish to save the template.
Note:
To view or edit an existing template, on the Set template properties page, click Browse for the template location  next to the Template text box. You can choose a template from the project folder or from other locations.
You can use this template in the Generate LRS Data Product tool.