Colorize LAS (3D Analyst Tools)
Summary
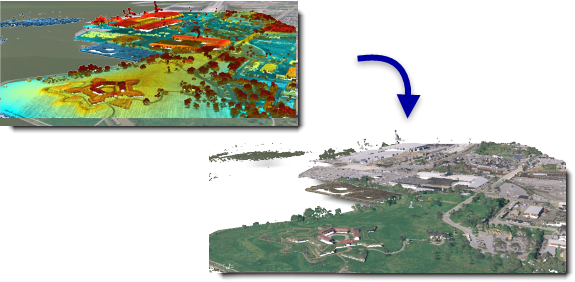
Applies colors and near-infrared values from orthographic imagery to LAS points.
Illustration
Usage
Displaying LAS points using RGB information can provide an immersive, photorealistic display that delivers a unique display experience. The visual feedback of true imagery superimposed onto LAS points can provide insight about the discrete characteristics of the point cloud that can be helpful when interactively classifying the data, digitizing new features, and establishing a reference point when taking 3D distance measurements.
The best imagery to use for applying colors to LAS points would be sourced from the same time as the lidar survey to achieve the best match with the features being captured. Lacking that, you would want to try using imagery that is as close to the scan date as possible to minimize differences due to events such as construction or the seasonal variation of deciduous leaves.
If your source imagery is composed of numerous tiled images, consider loading those tiles into a mosaic dataset to reference them as a single dataset and use it as the image input for colorizing your LAS data. Learn more about creating a mosaic dataset.
Only LAS file version 1.4 with point record format 8 supports the storage of near-infrared values for LAS points.
When a processing extent is defined, the entire LAS file that intersects the processing extent will be colorized. If only a subset of the input LAS file is desired, consider using the Extract LAS tool to clip out the subset, and use the resulting file as the input for this tool.
It is not uncommon for LAS point records to be stored in the
.lasfile in a binary sequence that does not correspond with the spatial clustering of the points. When data of such distribution is queried, it can result in less efficient access to the binary records that represent the LAS points. Rearranging the points in the resulting.lasfile will optimize the data for visualization and other spatial operations. Statistics will automatically be calculated when the rearrange option is enabled. If you don't rearrange the LAS points, you can enable or disable the calculation of statistics. Calculating statistics will optimize spatial queries and provide a summary of the class codes and return values that are present in the.lasfile. However, it will also add time to the processing of this tool. If the resulting.lasfiles will not be used in ArcGIS, you can disable the calculation of statistics so that the tool can process faster.
Parameters
| Label | Explanation | Data type |
|---|---|---|
|
Input LAS Dataset |
The LAS dataset that will be processed. |
LAS Dataset Layer |
|
Input Image |
The image that will be used to assign colors to LAS points. |
Mosaic Layer; Raster Layer |
|
Band Assignment |
The bands from the input image that will be assigned to the color channels associated with the output LAS points. Value table columns:
|
Value Table |
|
Target Folder |
The existing folder where the output LAS format files will be written. |
Folder |
|
Output File Name Suffix (Optional) |
The text that will be appended to the name of each output |
String |
|
LAS File Version (Optional) |
The LAS version of the output files being created.
|
String |
|
Point Format (Optional) |
The point record format of the output LAS files.
|
Long |
|
Compression (Optional) |
Specifies whether the output
|
String |
|
Rearrange Points (Optional) |
Specifies whether points in the
|
Boolean |
|
Compute Statistics (Optional) |
Specifies whether statistics will be computed for the
|
Boolean |
|
Output LAS Dataset (Optional) |
The output LAS dataset referencing the newly created |
LAS Dataset |
Derived output
| Label | Explanation | Data type |
|---|---|---|
|
Output Folder |
The folder that the output LAS files will be written out to. |
Folder |
Environments
Current Workspace, Extent, Output Coordinate System, Geographic Transformations
Licensing information
- Basic: Requires 3D Analyst
- Standard: Requires 3D Analyst
- Advanced: Requires 3D Analyst