Summarize Within (Analysis Tools)
Summary
Overlays a polygon layer with another layer to summarize the number of points, length of the lines, or area of the polygons within each polygon, and calculate attribute field statistics about the features within the polygons.
The following are example scenarios using Summarize Within:
From a layer of watershed boundaries and a layer of land-use boundaries by land-use type, calculate total acreage of land-use type for each watershed.
From a layer of parcels in a county and a layer of city boundaries, summarize the average value of vacant parcels within each city boundary.
From a layer of counties and a layer of roads, summarize the total mileage of roads by road type in each county.
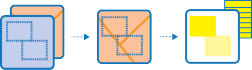
Illustration
Usage
Think of Summarize Within as taking two layers, the input polygons and the input summary features, and stacking them on top of each other. After stacking these layers, you can look down through the stack and count the number of input summary features that fall within the input polygons. You can also calculate simple statistics about the attributes of the input summary features, such as sum, mean, minimum, maximum, and so on.
The Summarize Within and Summarize Nearby tools are conceptually similar. Using the Summarize Within tool, you can summarize features within existing polygons. Using the Summarize Nearby tool, you can generate areas around points, lines, or polygons, and summarize features within those derived areas.
Polygon summary features are summarized using the areal proportions of the input features. Consider an input polygon that overlays a summary polygon by 1 square kilometer. If the summary polygon is 100 square kilometers, the tool will summarize 1/100 of the numeric values of the summary polygon. To ensure that proportional calculations are valid, use fields with counts and quantities rather than rates or ratios.
You can create groups by specifying a group field from the input points. For example, if you are summarizing crimes within neighborhood boundaries, you may have a
Crime_typeattribute with five crime types. Each unique crime type forms a group, and the statistics you choose will be calculated for each uniqueCrime_typevalue.Null values are excluded from all statistical calculations. For example, the average of 6, 4, and a null value is 5 ((6+4)/2).
Parameters
| Label | Explanation | Data type |
|---|---|---|
|
Input Polygons |
The polygons that will be used to summarize the features, or portions of features, in the input summary layer. |
Feature Layer |
|
Input Summary Features |
The point, line, or polygon features that will be summarized for each polygon in the input polygons. |
Feature Layer |
|
Output Feature Class |
The output polygon feature class containing the same geometries and attributes as the input polygons. The feature class will include additional attributes for the number of points, length of lines, and area of polygons inside each input polygon and statistics about those features. |
Feature Class |
|
Keep all input polygons (Optional) |
Specifies whether all input polygons or only those intersecting or containing at least one input summary feature will be copied to the output feature class.
|
Boolean |
|
Summary Fields (Optional) |
A list of attribute field names from the input summary features, as well as statistical summary types that will be calculated for those attribute fields for all points in each polygon. Summary fields must be numeric. Text and other attribute field types are not supported. Value table columns:
|
Value Table |
|
Add shape summary attributes (Optional) |
Specifies whether attributes for the number of points, length of lines, and area of polygon features summarized in each input polygon will be added to the output feature class.
|
Boolean |
|
Shape Unit (Optional) |
Specifies the unit that will be used when calculating shape summary attributes. If the input summary features are points, no shape unit is necessary, since only the count of points in each input polygon is added. If the input summary features are lines, specify a linear unit. If the input summary features are polygons, specify an areal unit.
|
String |
|
Group Field (Optional) |
An attribute field from the input summary features that will be used for grouping. Features that have the same group field value will be combined and summarized with other features with the same group field value. When a group field is provided, the Output Grouped Table parameter value is required. |
Field |
|
Add minority and majority attributes (Optional) |
Specifies whether minority and majority fields will be added to the output. This parameter allows you to determine which group field value is the minority (least dominant) and the majority (most dominant) within each input polygon. This parameter is enabled if you provided a Group Field parameter value.
|
Boolean |
|
Add group percentages (Optional) |
Specifies whether a percentage attribute field will be added to the output. This parameter allows you to determine the percentage of each attribute value in each group. This parameter is enabled if you provided a Group Field parameter value.
|
Boolean |
|
Output Grouped Table (Optional) |
An output table that includes summary fields for each group of summary features for each input polygon. The table will have the following attribute fields:
This parameter is required when the Group Field parameter value is provided. |
Table |
Environments
Output Coordinate System, Extent, Current Workspace, Scratch Workspace, Output has Z values, Z Resolution, Default Output Z Value, Geographic Transformations, Output XY Domain, Output Z Domain, XY Resolution, XY Tolerance, Z Tolerance
Licensing information
- Basic: Yes
- Standard: Yes
- Advanced: Yes