Generate Summary Table Data (Aviation Tools)
Summary
Collects information from a source cartographic feature class and related tables in an aviation charting database (AIS) and outputs the resulting information to a stand-alone table.
Summary tables provide a compilation of information describing all the features of a given type that appear on an aviation chart. For example, they may provide information about all the airports that appear on the front and back of a two-sided chart.
This tool gathers attribute information from a source cartographic feature class and optionally from related tables and populates the results in a target stand-alone table. The tool requires a user-configured Summary Table preference, which sets the source cartographic feature class, attributes collected, selection criteria, and target table.
The target stand-alone table can be used as the table source for a table frame in an aviation chart layout.
Usage
You must configure one or more Summary Table preferences to run the tool. To configure preferences, click the Aviation contextual tab. and in Configuration group, click the Preferences button
 . Alternatively, on the View tab, in the Windows group, click the Aviation drop-down arrow, and click the Preferences button .
The Charts Table parameter can be used with the AIS_Charts table from the AIS geodatabase schema.
Populate the
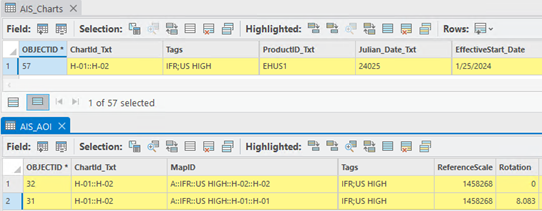
ChartId_Txtfield in the AIS_Charts table with a list of areas of interest (AOIs) from the same chart product into one grouping, for example, H-01::H-02.The
ChartId_Txtfield in the AIS_AOI table must match the value in the AIS_Charts table for each AIS_AOI feature to include in a chart product summary tabulation.The
Tagsfield values in AIS_Charts and AIS_AOI should match for corresponding data. Tags can be used to distinguish chart series such as IFR, High, Low, and VFR, and are used as selection criteria based onTagvalues set in the Summary Table preference.The following image shows an example of a populated AIS_Charts table row with its two corresponding AIS_AOI feature rows:
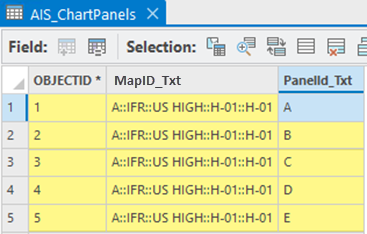
If you select the Has Panels option for the Summary Table preference, you must populate the AIS_ChartPanels polygon feature class with panel geometry and populate its
MapID_Txtfield with the value of its corresponding AIS_AOI and itsPanelId_Txtfield with the panel ID.The following image shows an example of a populated AIS_ChartPanels table's rows:
You can use a polygon feature class as input to the Charts Table parameter instead of using the AIS_Charts table. This allows you to make summary tabulations using a different area selection than the AIS_AOI feature groupings.
You must create your own polygon feature class to represent the input chart extent and tabulation areas before running the tool.
The input polygon feature class must contain the following populated text fields:
ChartID_Txt—A unique identifier or chart name, such as New OrleansTags—Populated with values matching theTagsvalues in the Summary Table preference
When you use a polygon feature class for the Charts Table parameter value, the Summary Table preference
Tagsvalues are used to filter the input polygon geometry and AIS_AOI features. The source cartographic features are then filtered by the filtered AIS_AOI features. Then, the filtered polygon feature class is used to spatially select the filtered source cartographic features.Before you run the tool, you must create the target stand-alone table with the following required text fields:
Preference_Txt—The output is populated with the preferences used to create the row.ChartID_Txt—The output is populated with theChartID_Txtvalue from the Charts Table parameter value.PanelID_TxtorPanels—The output is populated with the AIS_ChartPanels.PanelId_Txt value if the Has Panels preference option was used.
The target stand-alone table must contain user-created fields that will be populated with source attributes specified in the Summary Table preference.
If you run this tool on an enterprise database connection, refresh the output table, or close and re-open the table from the table of contents to view the new rows.
The tool updates the target stand-alone table by truncating all existing rows for the selected Summary Table preference and repopulates the data based on the preference.
Parameters
| Label | Explanation | Data type |
|---|---|---|
|
Target Geodatabase |
The Aviation charting schema geodatabase. |
Workspace |
|
Input Preferences |
The preferences stored in the database that control how, and for which charts, summary table information will be generated. |
String |
|
Charts Table |
The table or polygon feature class that defines chart areas for tabulation. If a table view or layer view is input, its definition query will be honored. |
Table View |
Derived output
| Label | Explanation | Data type |
|---|---|---|
|
Output Workspace |
The workspace populated with information from related tables in the database, based on preferences. |
Workspace |
Environments
This tool does not use any geoprocessing environments.
Licensing information
- Basic: No
- Standard: Requires ArcGIS Aviation Charting
- Advanced: Requires ArcGIS Aviation Charting