Aggregate Points (Standard Feature Analysis Tools)
Summary
Uses a layer of point features and a layer of polygon features to identify the points that fall within each polygon's area. After identifying the point-in-polygon spatial relationship, statistics about all points in the polygon are calculated and assigned to the area.
The most basic statistic is the count of the number of points within the polygon, but you can get other statistics as well. For example, if the points represent coffee shops and each point has a TOTAL_SALES attribute, you can get statistics such as the sum of all TOTAL_SALES values within the polygon, or the minimum or maximum TOTAL_SALES value, or the standard deviation of all sales within the polygon.
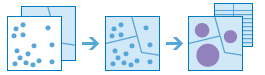
Illustration
Usage
This tool collects and summarizes point features within a set of boundaries. The input parameters must include points to be aggregated, as well as aggregation areas.
The Keep boundaries with no points parameter is checked by default. When the parameter is checked, all of the areas used in the analysis will be included in the result, regardless of the location of the points. Areas with no points will be empty and have a count of 0. When the parameter is unchecked, the areas with no points are removed from the result layer. Unchecking this parameter may have a significant effect on the result areas.
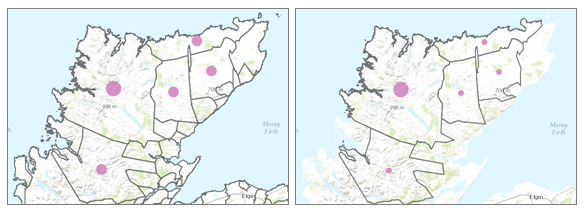
The difference in result layers when boundaries with no points are kept (first image) or not kept (second image) is shown. The most basic aggregations will calculate a count of the number of points in each boundary. Basic statistics (sum, minimum, maximum, average, and standard deviation) can also be calculated on numerical fields. The statistics will be calculated on each area separately.
Statistical calculations can also be grouped using a field with categorical values. When statistics are grouped by a field, the statistics are calculated for both the area as a whole and for each group. Both statistics can be viewed in the result layer's pop-up. The overall statistics are provided numerically, and the grouped statistics are shown in chart form in the pop-up. A summary table listing each feature and statistic by group field value will also be created. Checking the Add minority and majority attributes parameter will return the groups with the lowest and highest counts, and checking the Add percentage parameter will return the percentage of points in the minority and majority groups.
Point layers are summarized using only the point features within the input boundary. The results will be displayed using graduated symbols.
The figure and table below explain the statistical calculations of a point layer within a hypothetical boundary. The
Populationfield was used to calculate the statistics (Sum, Minimum, Maximum, Average, and Std Deviation) for the layer.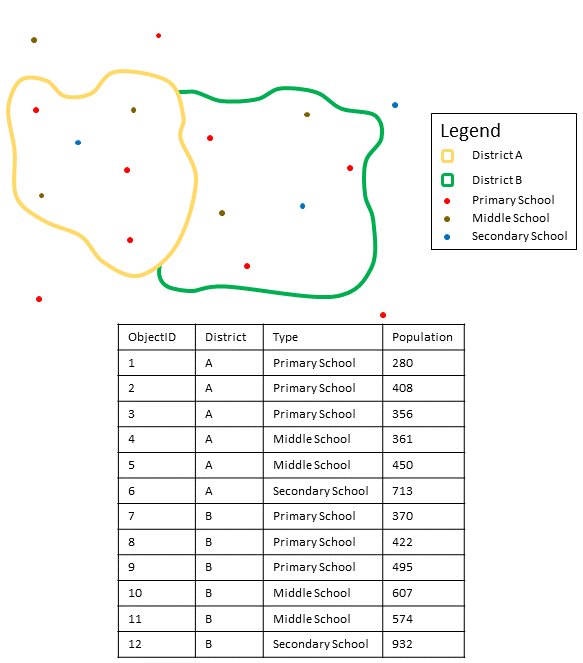
Point layers are summarized using only points located within the boundary layer. An example attribute table with values to be used in hypothetical statistic calculations is shown. Statistic
Results District A
Sum
\(280 \space + \space 408 \space + \space 356 \space + \space 361 \space + \space 450 \space + \space 713 \space = \space 2,568\)
Minimum
Minimum of
\([280, \space 408, \space 356, \space 361, \space 450, \space 713] \space = \space 280\)
Maximum
Maximum of
\([280, \space 408, \space 356, \space 361, \space 450, \space 713] \space = \space 713\)
Average
\(2,568/6 \space = \space 428\)
Std Deviation

\(= \space 150.79\)
Parameters
| Label | Explanation | Data type |
|---|---|---|
|
Input Points |
The point features that will be aggregated into the polygons in the polygon layer. |
Feature Set |
|
Aggregating Polygons |
The polygon features (areas) into which the input points will be aggregated. |
Feature Set |
|
Output Name |
The name of the output layer that will be created on your portal. |
String |
|
Keep boundaries with no points (Optional) |
Specifies whether the polygons that have no points within them will be returned in the output.
|
Boolean |
|
Summary Fields (Optional) |
A list of field names and statistical summary type that will be calculated for all points within each polygon. The count of points within each polygon is always returned. Value table columns:
|
Value Table |
|
Group By Field (Optional) |
A field name in the You can create statistical groups using an attribute in the analysis layer. For example, if you are aggregating crimes to neighborhood boundaries, you may have a |
Field |
|
Add minority and majority attributes (Optional) |
Specifies whether minority and majority fields will be added. This parameter is applicable only when a
|
Boolean |
|
Add percentage (Optional) |
Specifies whether percentage fields will be added to the output. This parameter is applicable only when a
|
Boolean |
Derived output
| Label | Explanation | Data type |
|---|---|---|
|
Output Layer |
The output layer. |
Feature Set |
|
Output Group Layer |
The output table that summarizes the groups from the Group By Field. |
Record Set |
Environments
Output Coordinate System, Extent, Current Workspace
Licensing information
- Basic: Requires your account in ArcGIS Enterprise to have the Perform Analysis privilege
- Standard: Requires your account in ArcGIS Enterprise to have the Perform Analysis privilege
- Advanced: Requires your account in ArcGIS Enterprise to have the Perform Analysis privilege