Cross Validation (Geostatistical Analyst Tools)
Summary
Removes one data location and predicts the associated data using the data at the rest of the locations. The primary use for this tool is to compare the predicted value to the observed value in order to obtain useful information about some of your model parameters.
Usage
When using this tool in Python, the
resultobject contains both a feature class and aCrossValidationResult, which has the following properties:Count—Total number of samples used.
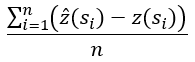
Mean Error—The averaged difference between the measured and the predicted values.
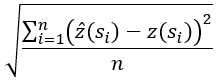
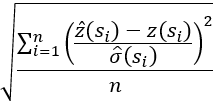
Root Mean Square Error—Indicates how closely your model predicts the measured values. The smaller this error, the better.
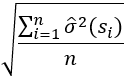
Average Standard Error—The average of the prediction standard errors.
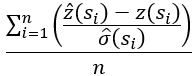
Mean Standardized Error—The average of the standardized errors. This value should be close to 0.
Root Mean Square Standardized Error—This should be close to 1 if the prediction standard errors are valid. If the root-mean-squared standardized error is greater than 1, you are underestimating the variability in your predictions. If the root-mean-square-standardized error is less than 1, you are overestimating the variability in your predictions.
Percent in 90% Interval—The percentage of points that are in a 90 percent cross-validation confidence interval. This value should be close to 90.
Percent in 95% Interval—The percentage of points that are in a 95 percent cross-validation confidence interval. This value should be close to 95.
Average CRPS—The average Continuous Ranked Probability Score (CRPS) of all points. The CRPS is a diagnostic that measures the deviation from the predictive cumulative distribution function to each observed data value. This value should be as small as possible. This diagnostic has advantages over other cross-validation diagnostics because it compares the data to a full distribution rather than to single-point predictions. The calculation of this statistic involves simulations so it cannot be written in a simple formula.
Only the Mean and Root Mean Square Error results are available for IDW, Global Polynomial Interpolation, Radial Basis Functions, Diffusion Interpolation With Barriers, and Kernel Interpolation With Barriers.
Percent in 90% Interval, Percent in 95% Interval, and Average CRPS are only available for Empirical Bayesian Kriging and EBK Regression Prediction models.
The fields in the optional output feature class are described in the GA Layer To Points tool.
Parameters
| Label | Explanation | Data type |
|---|---|---|
|
Input geostatistical layer |
The geostatistical layer to be analyzed. |
Geostatistical Layer |
|
Output point feature class (Optional) |
Stores the cross-validation statistics at each location in the geostatistical layer. |
Feature Class |
Derived output
| Label | Explanation | Data type |
|---|---|---|
|
Count |
Total number of samples used. |
Long |
|
Mean error |
Mean Error—The averaged difference between the measured and the predicted values. |
Double |
|
Root mean square |
Root Mean Square Error—Indicates how closely your model predicts the measured values. |
Double |
|
Average standard |
Average Standard Error—The average of the prediction standard errors. |
Double |
|
Mean standardized |
Mean Standardized Error—The average of the standardized errors. |
Double |
|
Root mean square standardized |
Root Mean Square Standardized Error—This should be close to 1 if the prediction standard errors are valid. |
Double |
|
Percent in 90% Interval |
Percent in 90% Interval—The percentage of points that are in a 90 percent cross-validation confidence interval. This value should be close to 90. |
Double |
|
Percent in 95% Interval |
Percent in 95% Interval—The percentage of points that are in a 95 percent cross-validation confidence interval. This value should be close to 95. |
Double |
|
Average CRPS |
Average CRPS—The average Continuous Ranked Probability Score (CRPS) of all points. The CRPS is a diagnostic that measures the deviation from the predictive cumulative distribution function to each observed data value. This value should be as small as possible. This diagnostic has advantages over other cross-validation diagnostics because it compares the data to a full distribution rather than to single-point predictions. The calculation of this statistic involves simulations so it cannot be written in a simple formula. |
Double |
Environments
Current Workspace, Geographic Transformations, Output Coordinate System, Parallel Processing Factor
Licensing information
- Basic: Requires Geostatistical Analyst
- Standard: Requires Geostatistical Analyst
- Advanced: Requires Geostatistical Analyst