Time Series Cross Correlation (Space Time Pattern Mining Tools)
Summary
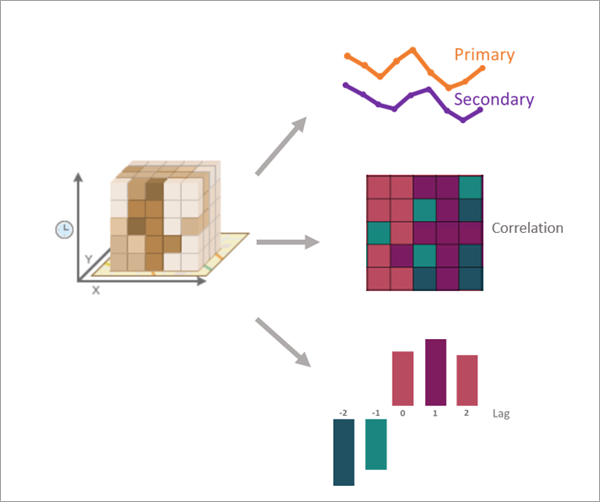
Calculates the cross correlation at various time lags between two time series stored in a space-time cube.
The cross correlation is calculated by pairing the corresponding values of each time series and calculating a Pearson correlation coefficient. The second time series is then shifted by one time step, and a new correlation is calculated. This shifting repeats up to a specified maximum number of time steps. The time lag (shift) with the strongest correlation is an estimate of the delay between changes in one time series and responses in the other (for example, the delay between advertising spending and sales revenue). You can filter and remove trends from the time series to test for statistically significant dependence between the variables. You can also include spatial neighbors in the calculations to incorporate spatial relationships between the two time series.
Illustration
Usage
The sign (positive or negative) of a time lag value is interpreted as the shift of the secondary analysis variable relative to the primary analysis variable. For example, a time lag value of 5 means that the secondary variable is shifted five time steps forward (right on the time axis) before calculating the cross correlation. If the time lag with the strongest correlation is positive, it means that changes in the value of the secondary analysis variable occur before changes in the primary analysis variable. Similarly, a time lag value of -3 means that the secondary time series is shifted three time steps backward (left on the time axis). If the time lag with strongest correlation is negative, it means that changes in the primary analysis variable occur before changes in the secondary analysis variable.
The primary output of the tool is a feature class containing the cross correlation results of each location for all time lags. In a map, a group layer will be added containing six layers from different fields of the output features: three layers of the strongest correlations (strongest positive, strongest negative, and strongest in absolute value) and three layers of the associated time lags for each of the strongest correlations. You can use these layers to quickly identify which locations had the strongest correlations and which time lags produced the correlations.
Optionally, you can create pop-up charts on the output features summarizing and visualizing the correlations across all lags at each location. You can also create output tables containing all individual correlations between locations at every time lag.
Use the Spatial Neighbors to Include in Calculations parameter to calculate the cross correlations using neighborhoods around each location. This is appropriate when the time series of nearby locations tend to be more similar than time series of locations that are farther away. If neighbors are used, the cross correlation of a location is a weighted average of the correlations between the primary variable of the focal location and the secondary variable of each of its neighbors (including itself). For example, if a location has five neighbors, the cross correlation of the location is a weighted average of six correlations: the correlation between the primary variable of the focal location and secondary variable of the focal location, the correlation between the primary variable of the focal location and the secondary variable of the first neighbor, the correlation between the primary variable of the focal location and the secondary variable of the second neighbor, and so on. The Spatial Neighbor Weighting Method parameter specifies the weights that will be used in the weighted average.
To test the statistical significance of the cross correlations at each lag, the Filter and Remove Trends parameter must be checked. When checked, p-values and 95 percent confidence intervals will be calculated for all lags at all locations. Additionally, significance testing can only be performed on pairwise correlations between two time series (rather than a weighted average of multiple correlations), so if you include spatial neighbors in calculations, only the output pairwise correlations table will contain p-values and confidence intervals. If neighbors are not included, the output features and the output lagged correlations table will contain p-value and confidence interval fields.
Caution:
The statistical significance tests are independently performed for each time lag of each location, and there is no correction for multiple hypothesis testing. Be cautious when interpreting the significance of any particular p-value or confidence interval.
Learn more about removing trends and filtering autocorrelation
The same analysis variable can be entered for both the primary and secondary analysis variables (called an autocorrelation analysis). However, the results may be difficult to interpret because a time series is always perfectly correlated with itself when the time lag value is zero (unshifted). The output features and correlation tables will contain the correlation results of all time lags, and the results at time lag zero can be filtered or deselected.
Parameters
| Label | Explanation | Data type |
|---|---|---|
|
Input Space Time Cube |
The space-time cube containing the variable to be analyzed. Space-time cubes have an |
File |
|
Primary Analysis Variable |
The numeric variable of the space-time cube containing the time series values of the primary variable. |
String |
|
Secondary Analysis Variable |
The numeric variable of the space-time cube containing the secondary analysis variable. When using time lags, the secondary analysis variable is shifted relative to the primary analysis variable. |
String |
|
Output Features |
The output features containing the cross correlations of all locations for all time lags. The output will also have fields of the strongest correlations (positive, negative, and absolute) and fields of the correlations of all time lags. If you filter and remove trends, and you do not use neighbors, the output will contain fields of p-values and 95 percent confidence intervals of all cross correlations. |
Feature Class |
|
Enable Time Series Pop-ups (Optional) |
Specifies whether time series charts will be created in the pop-ups of each output feature showing the cross correlation results. Time series pop-ups are not supported for shapefile outputs.
|
Boolean |
|
Maximum Time Lag (Optional) |
The maximum number of time lags that will be used to shift the secondary analysis variable. Cross correlations will be calculated for every time lag value up to the maximum. Provide a positive value even for negative time lags; for example, if 10 is provided for this parameter and the time lag direction shifts the secondary variable both directions, cross correlations will be calculated for all time lags between -10 and 10. If no value is provided, a value will be determined based on the length of the time series. Provide a value of 0 to calculate only the raw correlation between the time series without any time lags. |
Long |
|
Secondary Variable Lag Direction (Optional) |
Specifies the direction of the time lag. The secondary variable can be shifted forward in time (relative to the primary variable), backward in time, or in both directions.
|
String |
|
Spatial Neighbors to Include in Calculations (Optional) |
Specifies the neighbors around each location that will be used in calculations. If neighbors are used, the cross correlation of a location is the weighted average of the correlations between the primary variable of the focal location and the secondary variable of each of its neighbors (including itself).
|
String |
|
Number of Spatial Neighbors (Optional) |
The number of nearest locations that will be included as neighbors in the calculations. |
Long |
|
Distance Band (Optional) |
All locations within this distance will be included as neighbors. If no value is provided, one will be estimated during processing and included as a geoprocessing message. If the specified distance results in more than 1,000 neighbors, only the closest 1,000 locations will be included as neighbors. For polygons, the distance between centroids is used to determine neighbors. |
Linear Unit |
|
Spatial Neighbor Weighting Method (Optional) |
Specifies the weighting scheme that will be applied to spatial neighbors when calculating the correlations. The weights are used when calculating the weighted average of the correlation between the focal feature and each neighbor.
|
String |
|
Filter and Remove Trend (Optional) |
Specifies whether trends, seasonality, and autocorrelation will be removed from the primary analysis variable and used to filter the secondary analysis variable.
|
Boolean |
|
Output Lagged Correlations Table (Optional) |
A table containing the correlations of every time lag of every location. |
Table |
|
Output Pairwise Correlations Table (Optional) |
A table containing the pairwise correlations between each location and each neighbor at all time lags. |
Table |
Derived output
| Label | Explanation | Data type |
|---|---|---|
|
Output Layer Group |
A group layer of the output layers. |
Group Layer |
Environments
Parallel Processing Factor, Output Coordinate System
Licensing information
- Basic: Yes
- Standard: Yes
- Advanced: Yes