Explore query results
An openCypher query can return a variety of results. When the query returns a list of entities or relationships, they are displayed in the results list with one entity or relationship per row. Values returned by the query appear in columns in the order they are listed in the query return statement.
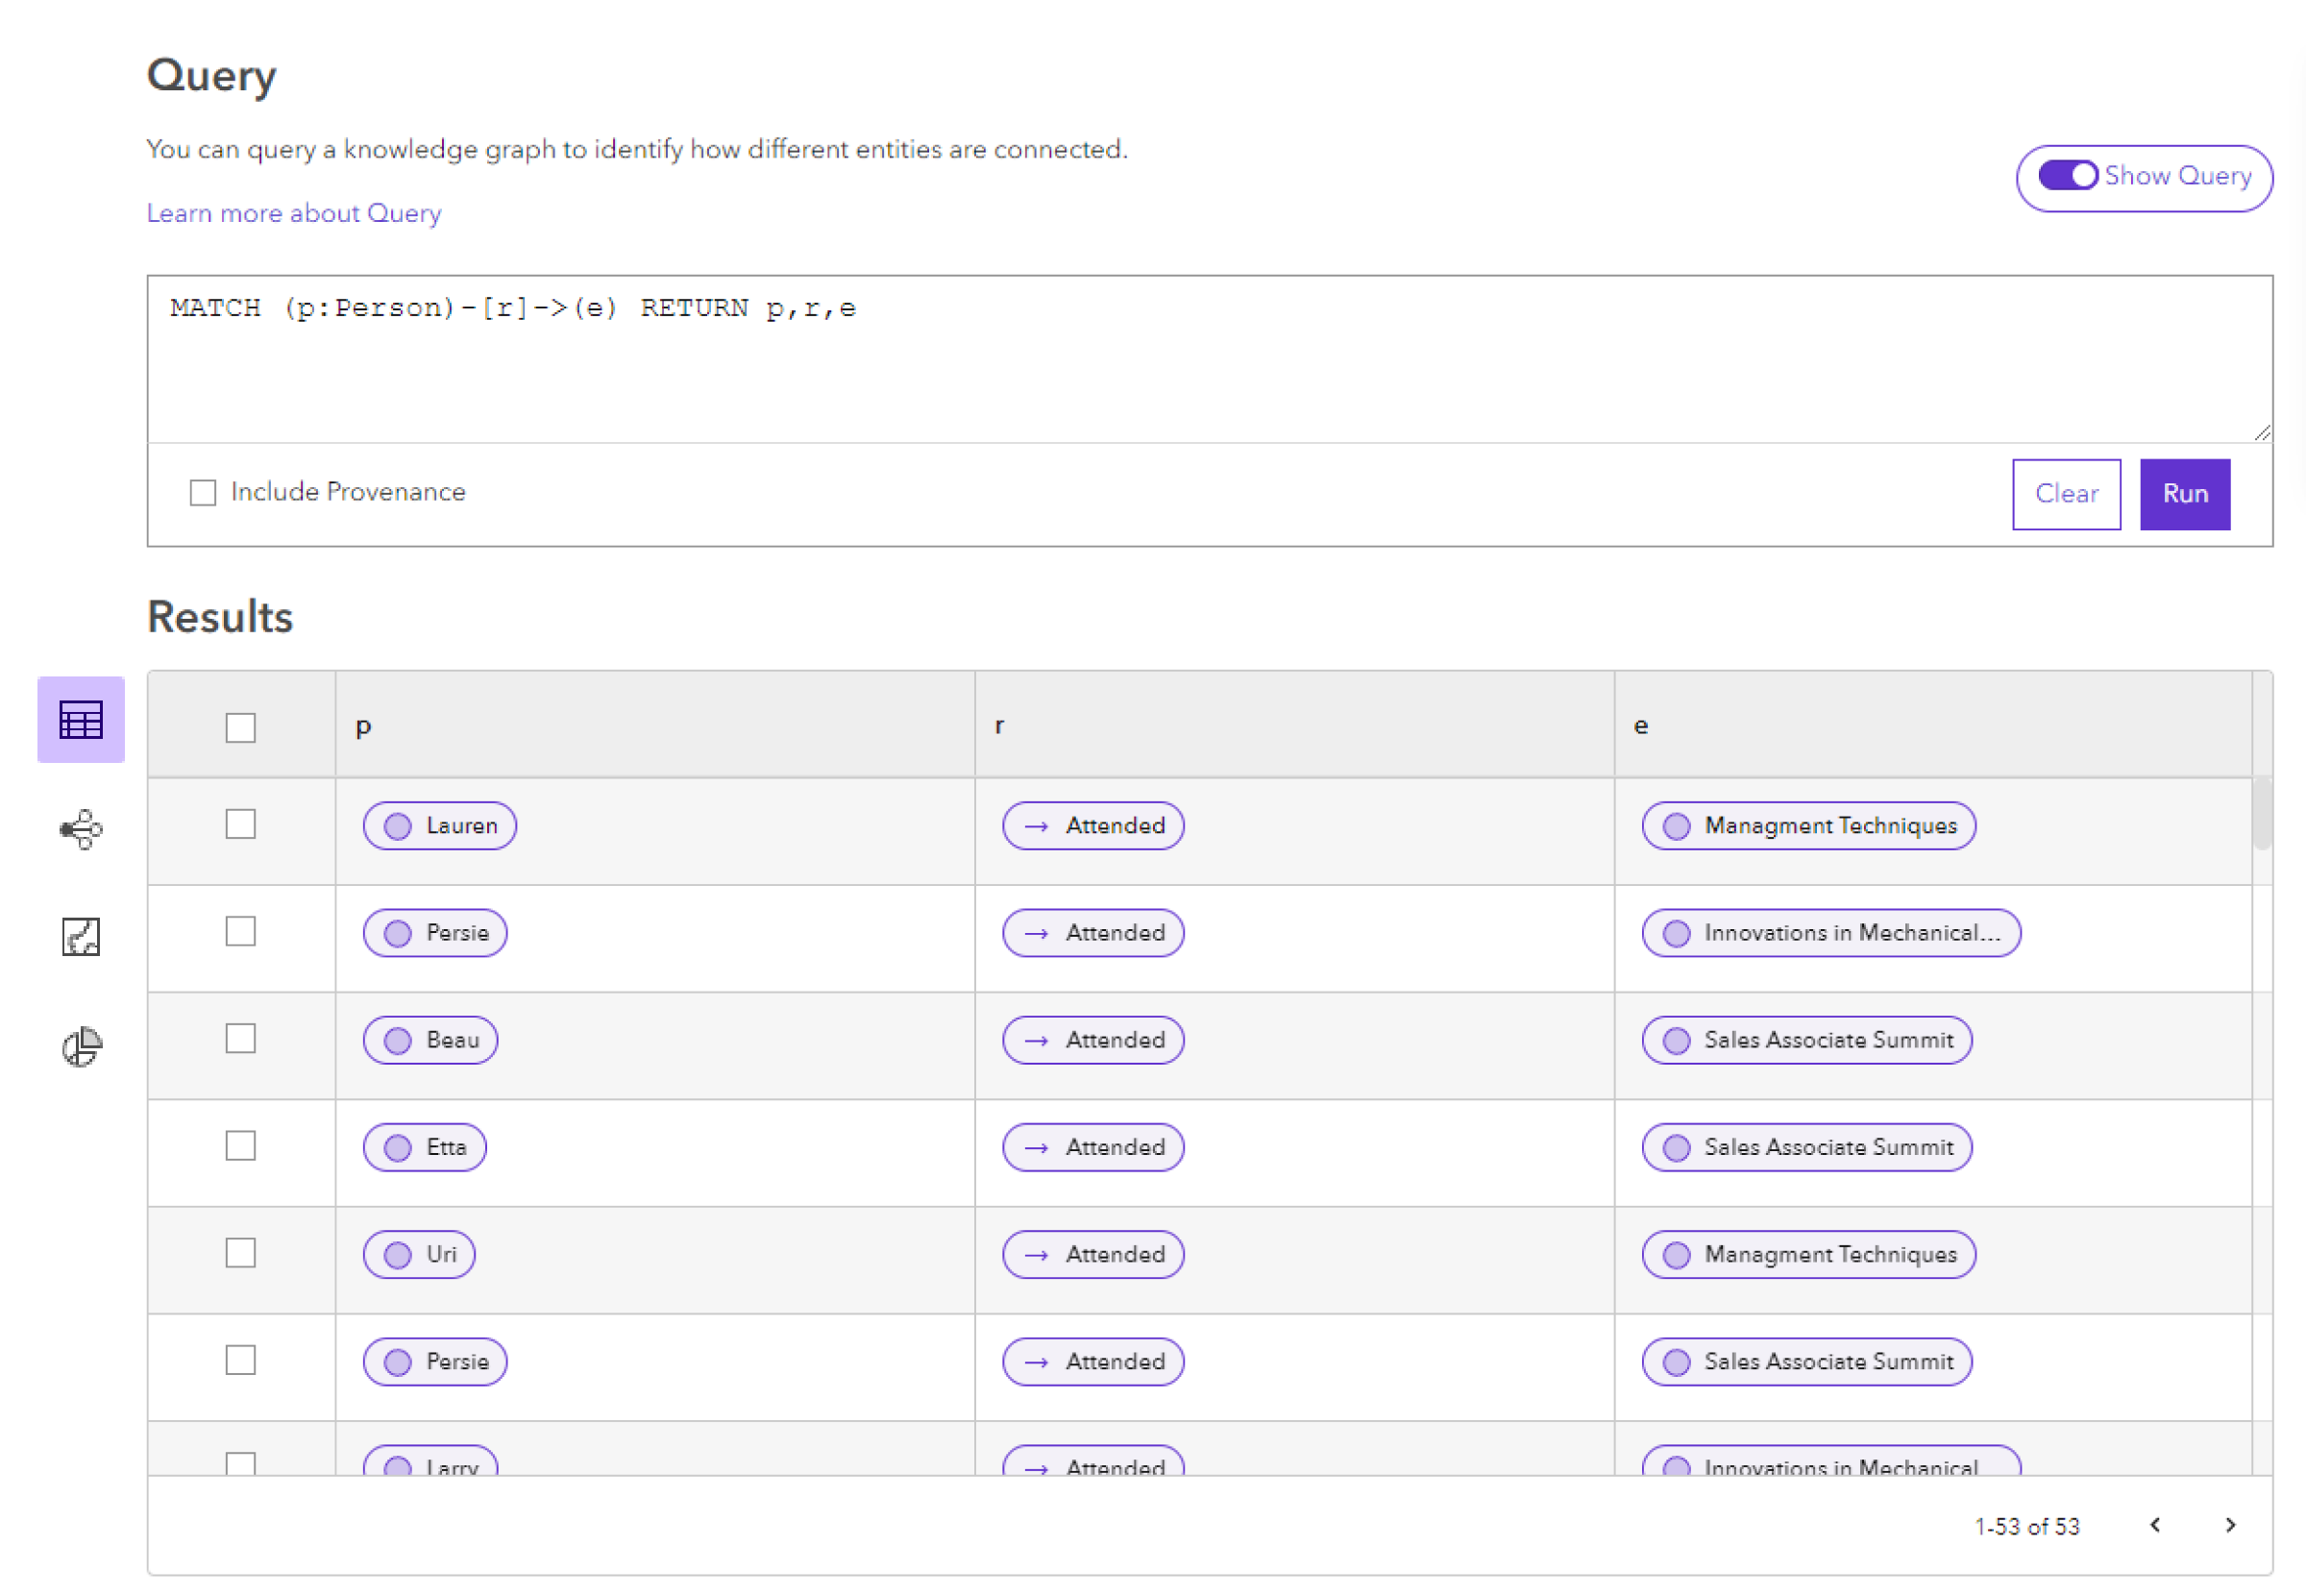
An openCypher query may return results that show which entities have a given relationship to another entity. In this case, the results table will show one row for each triple where a triple consists of the origin entity, the relationship, and the target entity. For example, a query such as MATCH (p:Person)-[r]->(e) RETURN p,r,e would return a results list in which each row in the results table represents a person, a relationship between that persona and another entity, and the target entity of the relationship. In this case, the results table would have a column for the person titled p, a column for the relationship titled r, and a title for the target entity titled e.
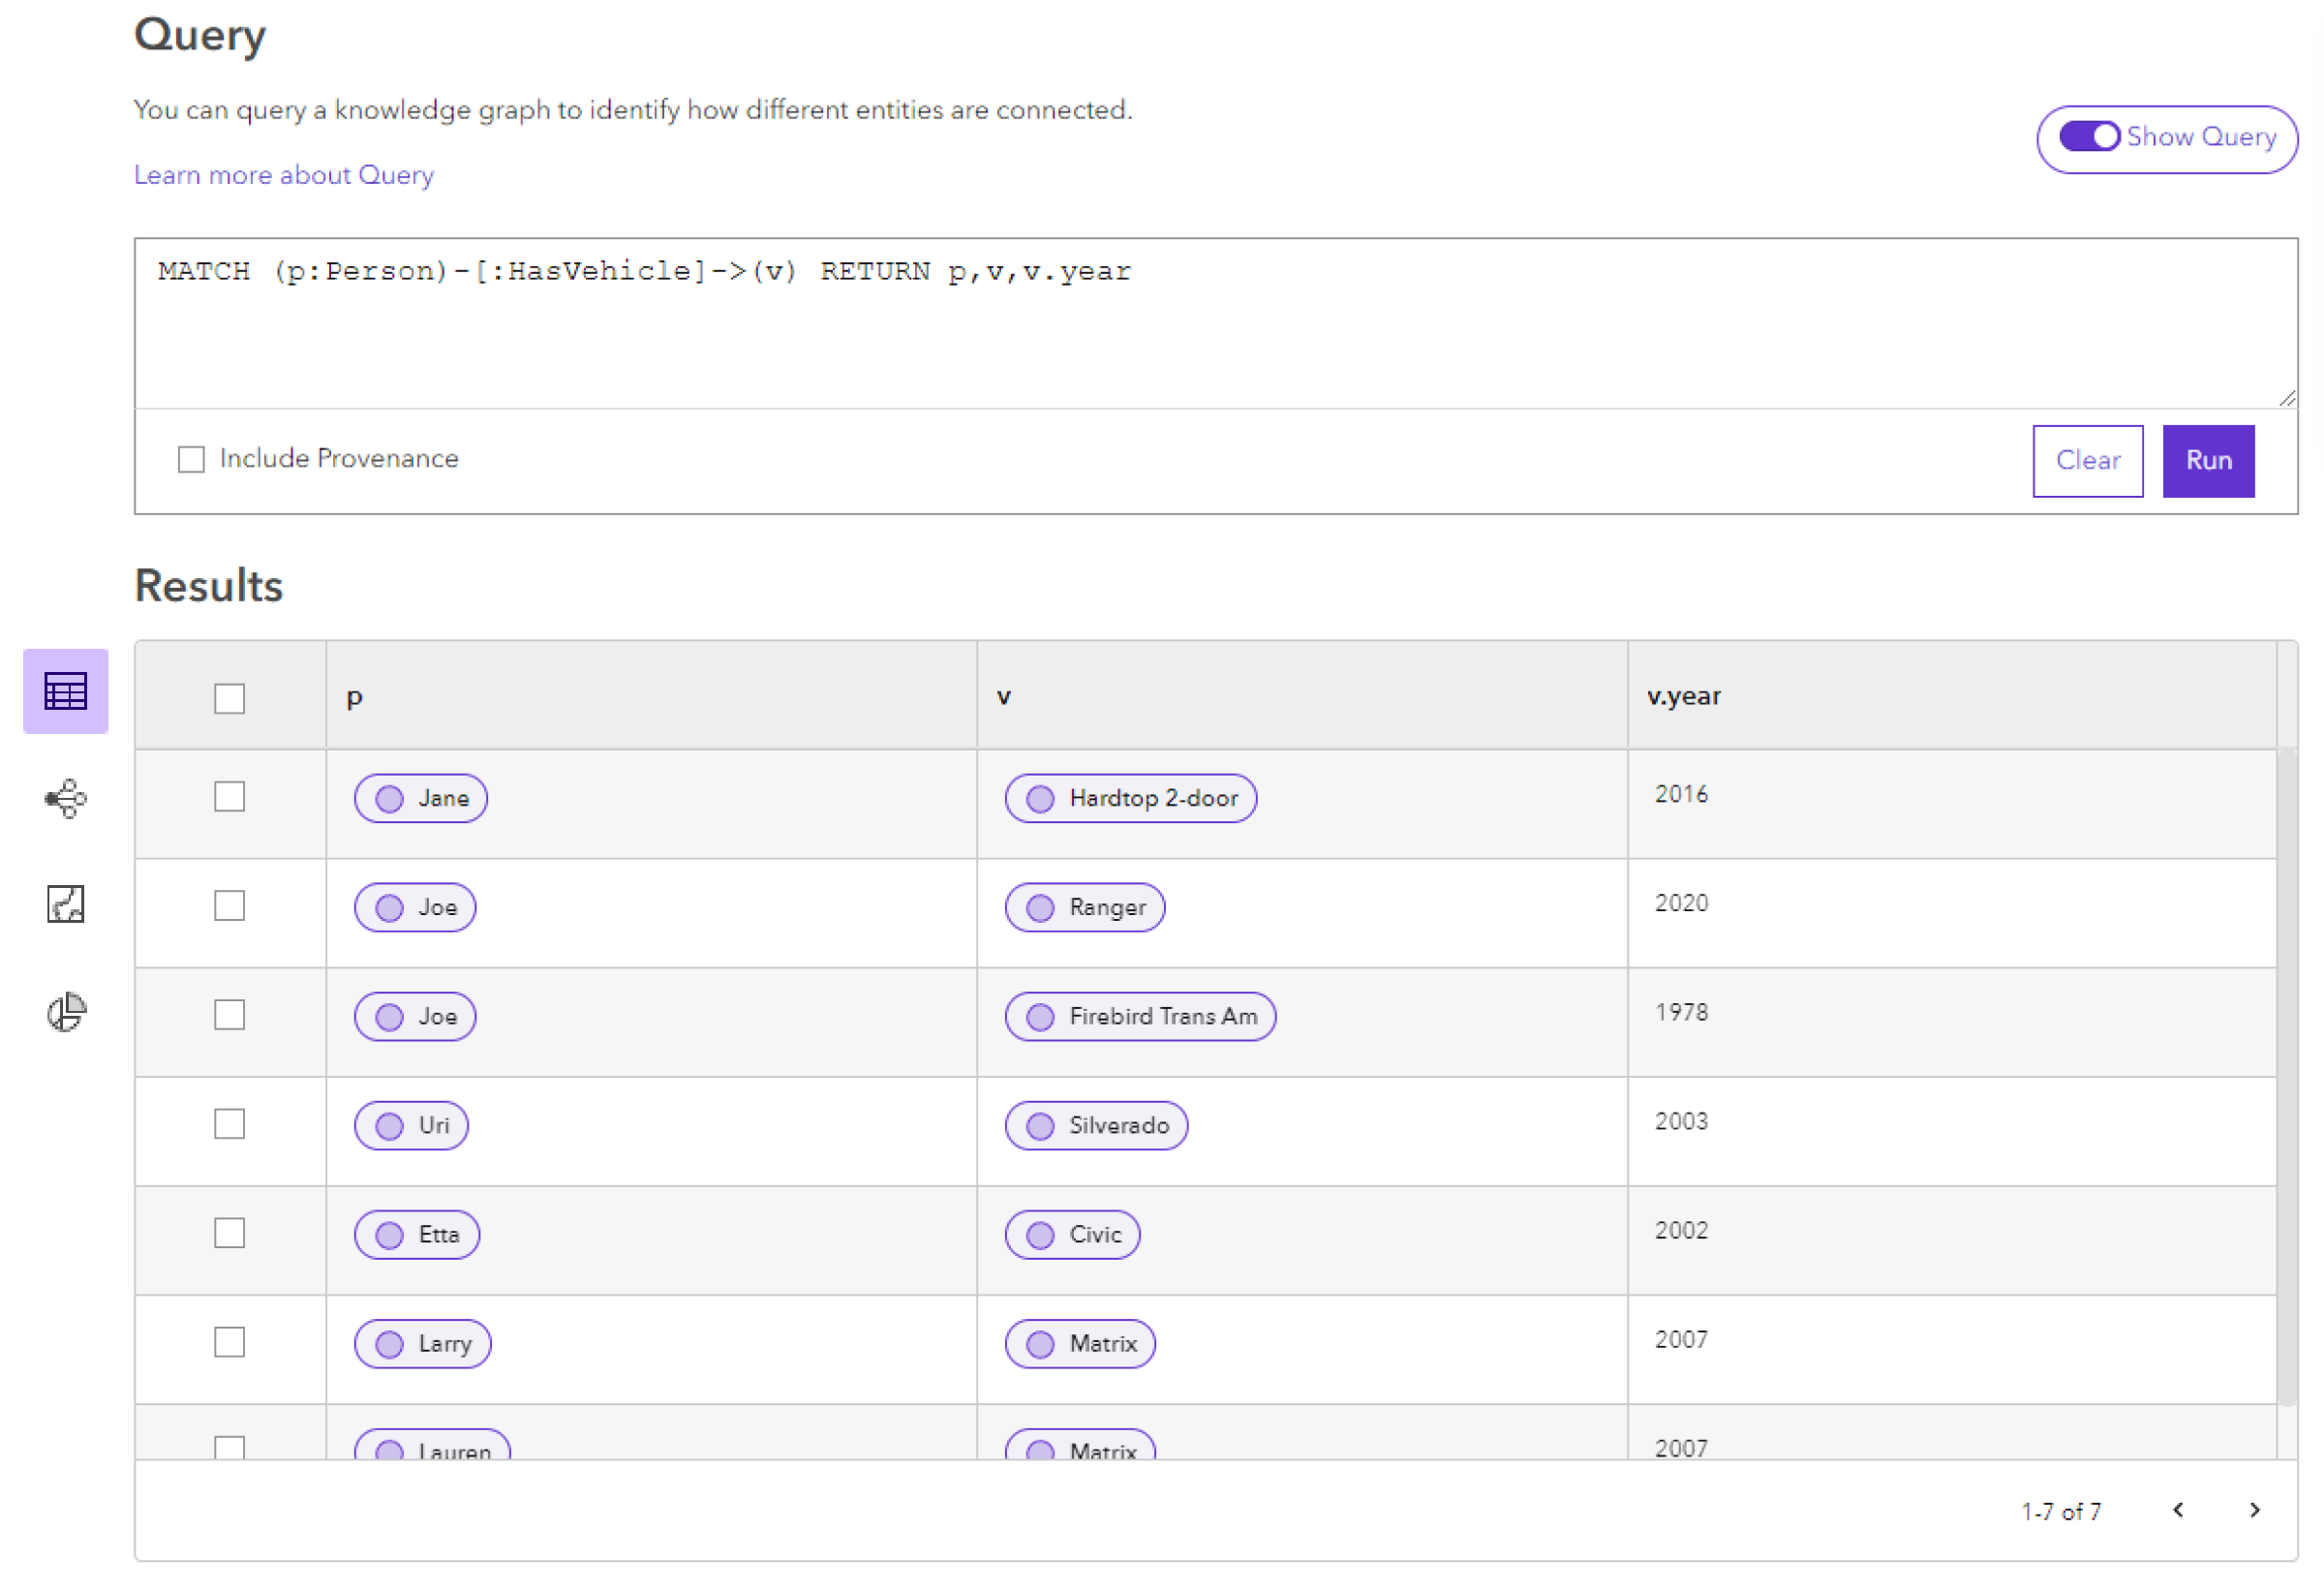
If instead, the query returns specific properties of entities or relationships, the results list will display those values in each column. For example, a query such as MATCH (p:Person)-[:HasVehicle]->(v) RETURN p,v,v.year will return the display name of the Person entity in the p column, the display name of the Vehicle entity in the v column, and the value of the Vehicle entity's year property in the v.year column. If an entity doesn't have a value for a specific property that is returned by a query, you will see (NULL) as a representation of the fact that there is no value to show.
The example below illustrates a query that returns a Person entity in which the person participates in a HasVehicle relationship with the vehicle. The query also returns the acquisitionDate property of the HasVehicle relationship, and the make property of the Vehicle entity.
Columns containing an entity ![]() , relationship
, relationship ![]() or provenance record will show the display name for the record along with its icon.
or provenance record will show the display name for the record along with its icon.
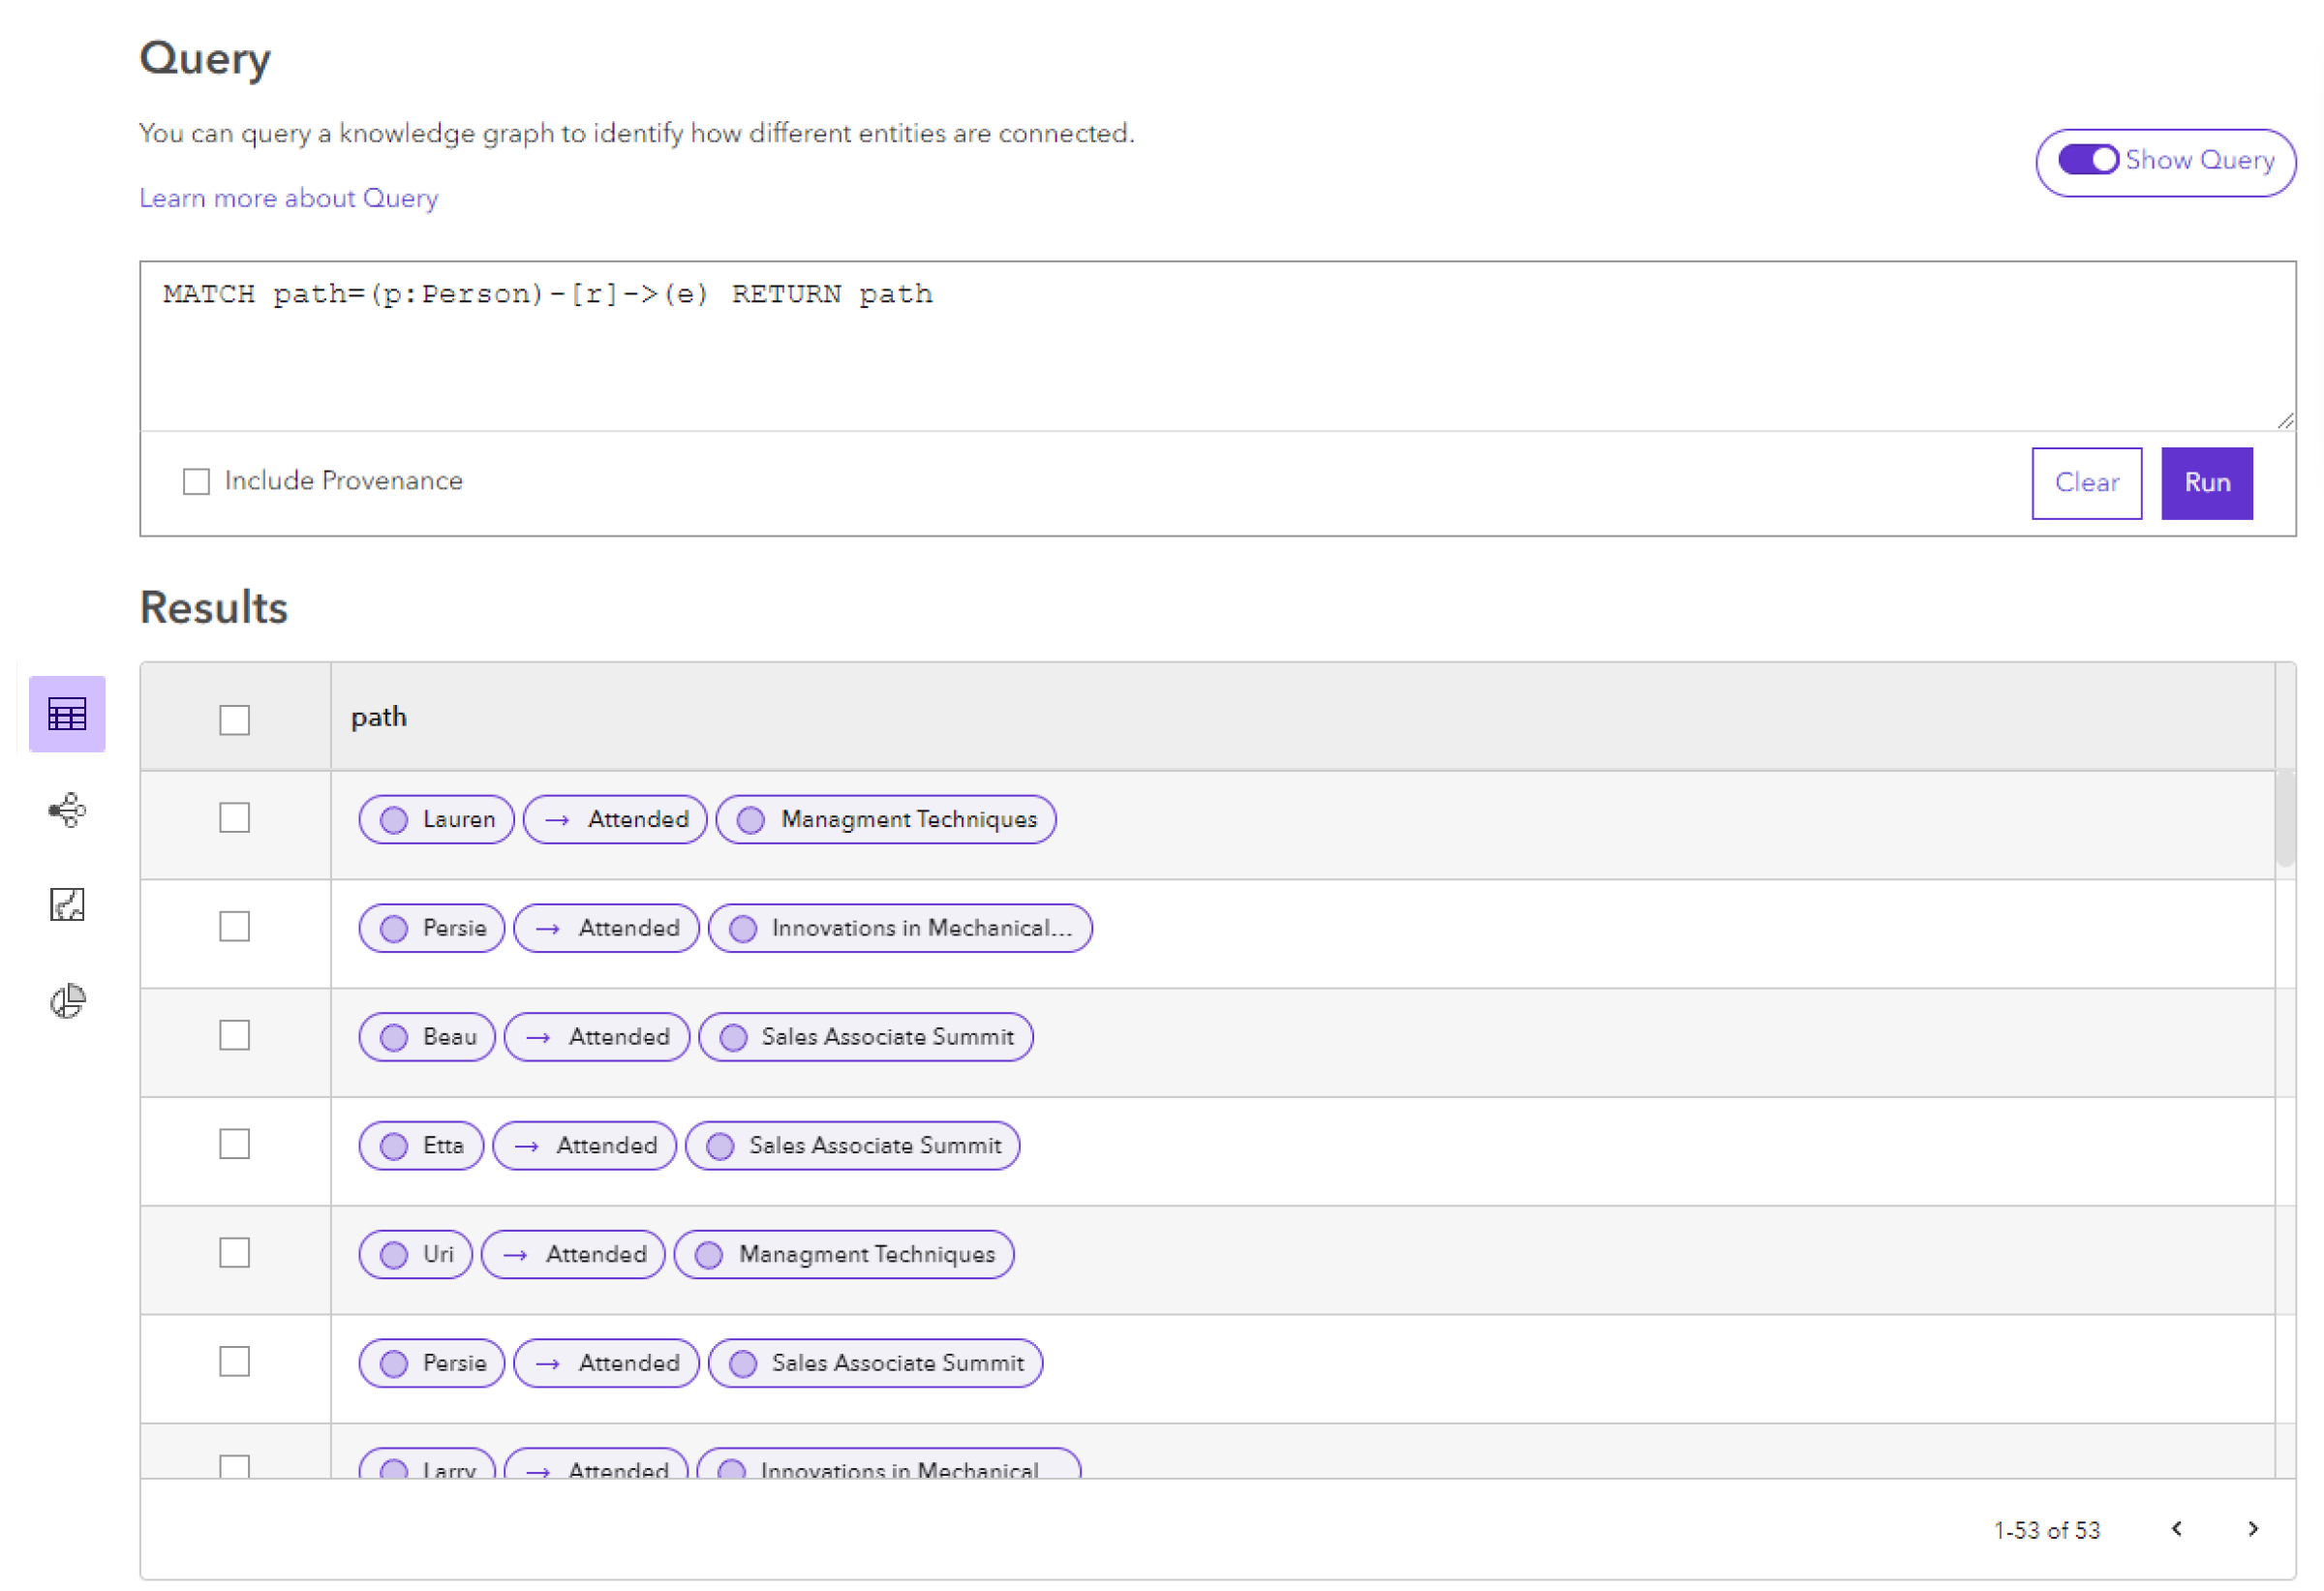
A third common type of query returns a path between one entity and another. A path contains all entities and relationships between the specified origin and destination entities. For example, a query such as MATCH path=(p:Person)-[r]->(e) RETURN path will return all of the paths to any entities connected to a Person entity by one relationship.
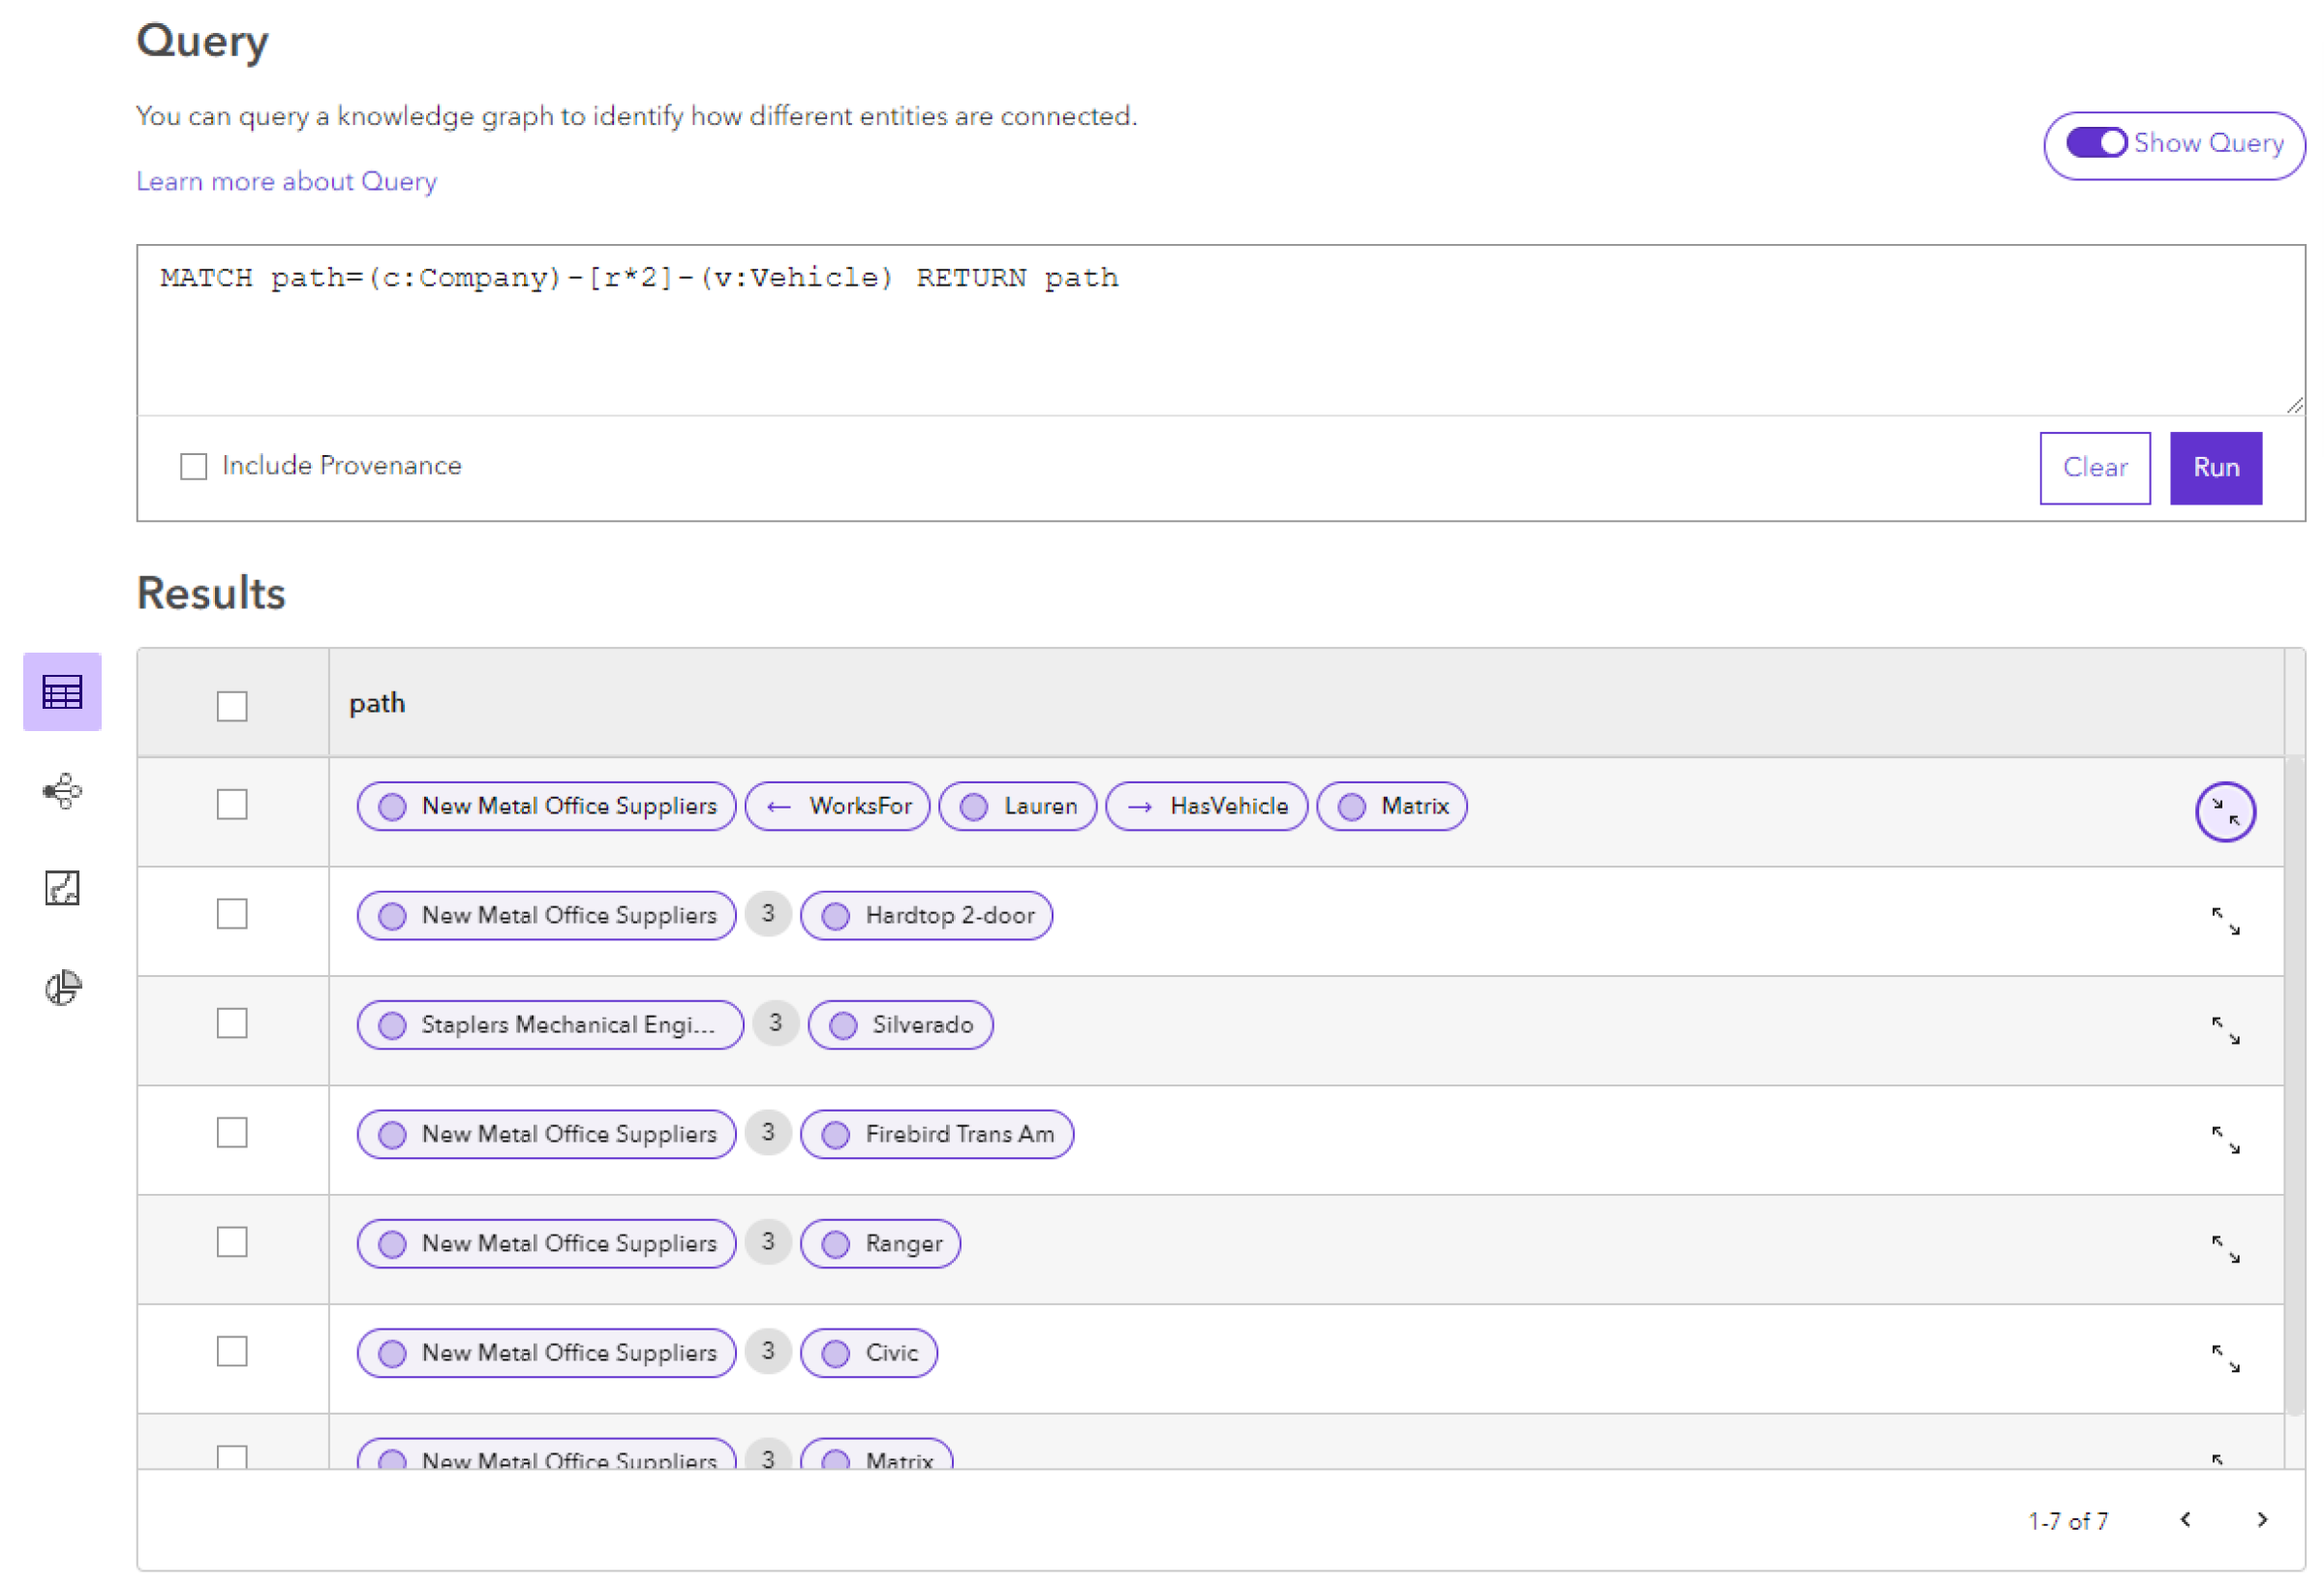
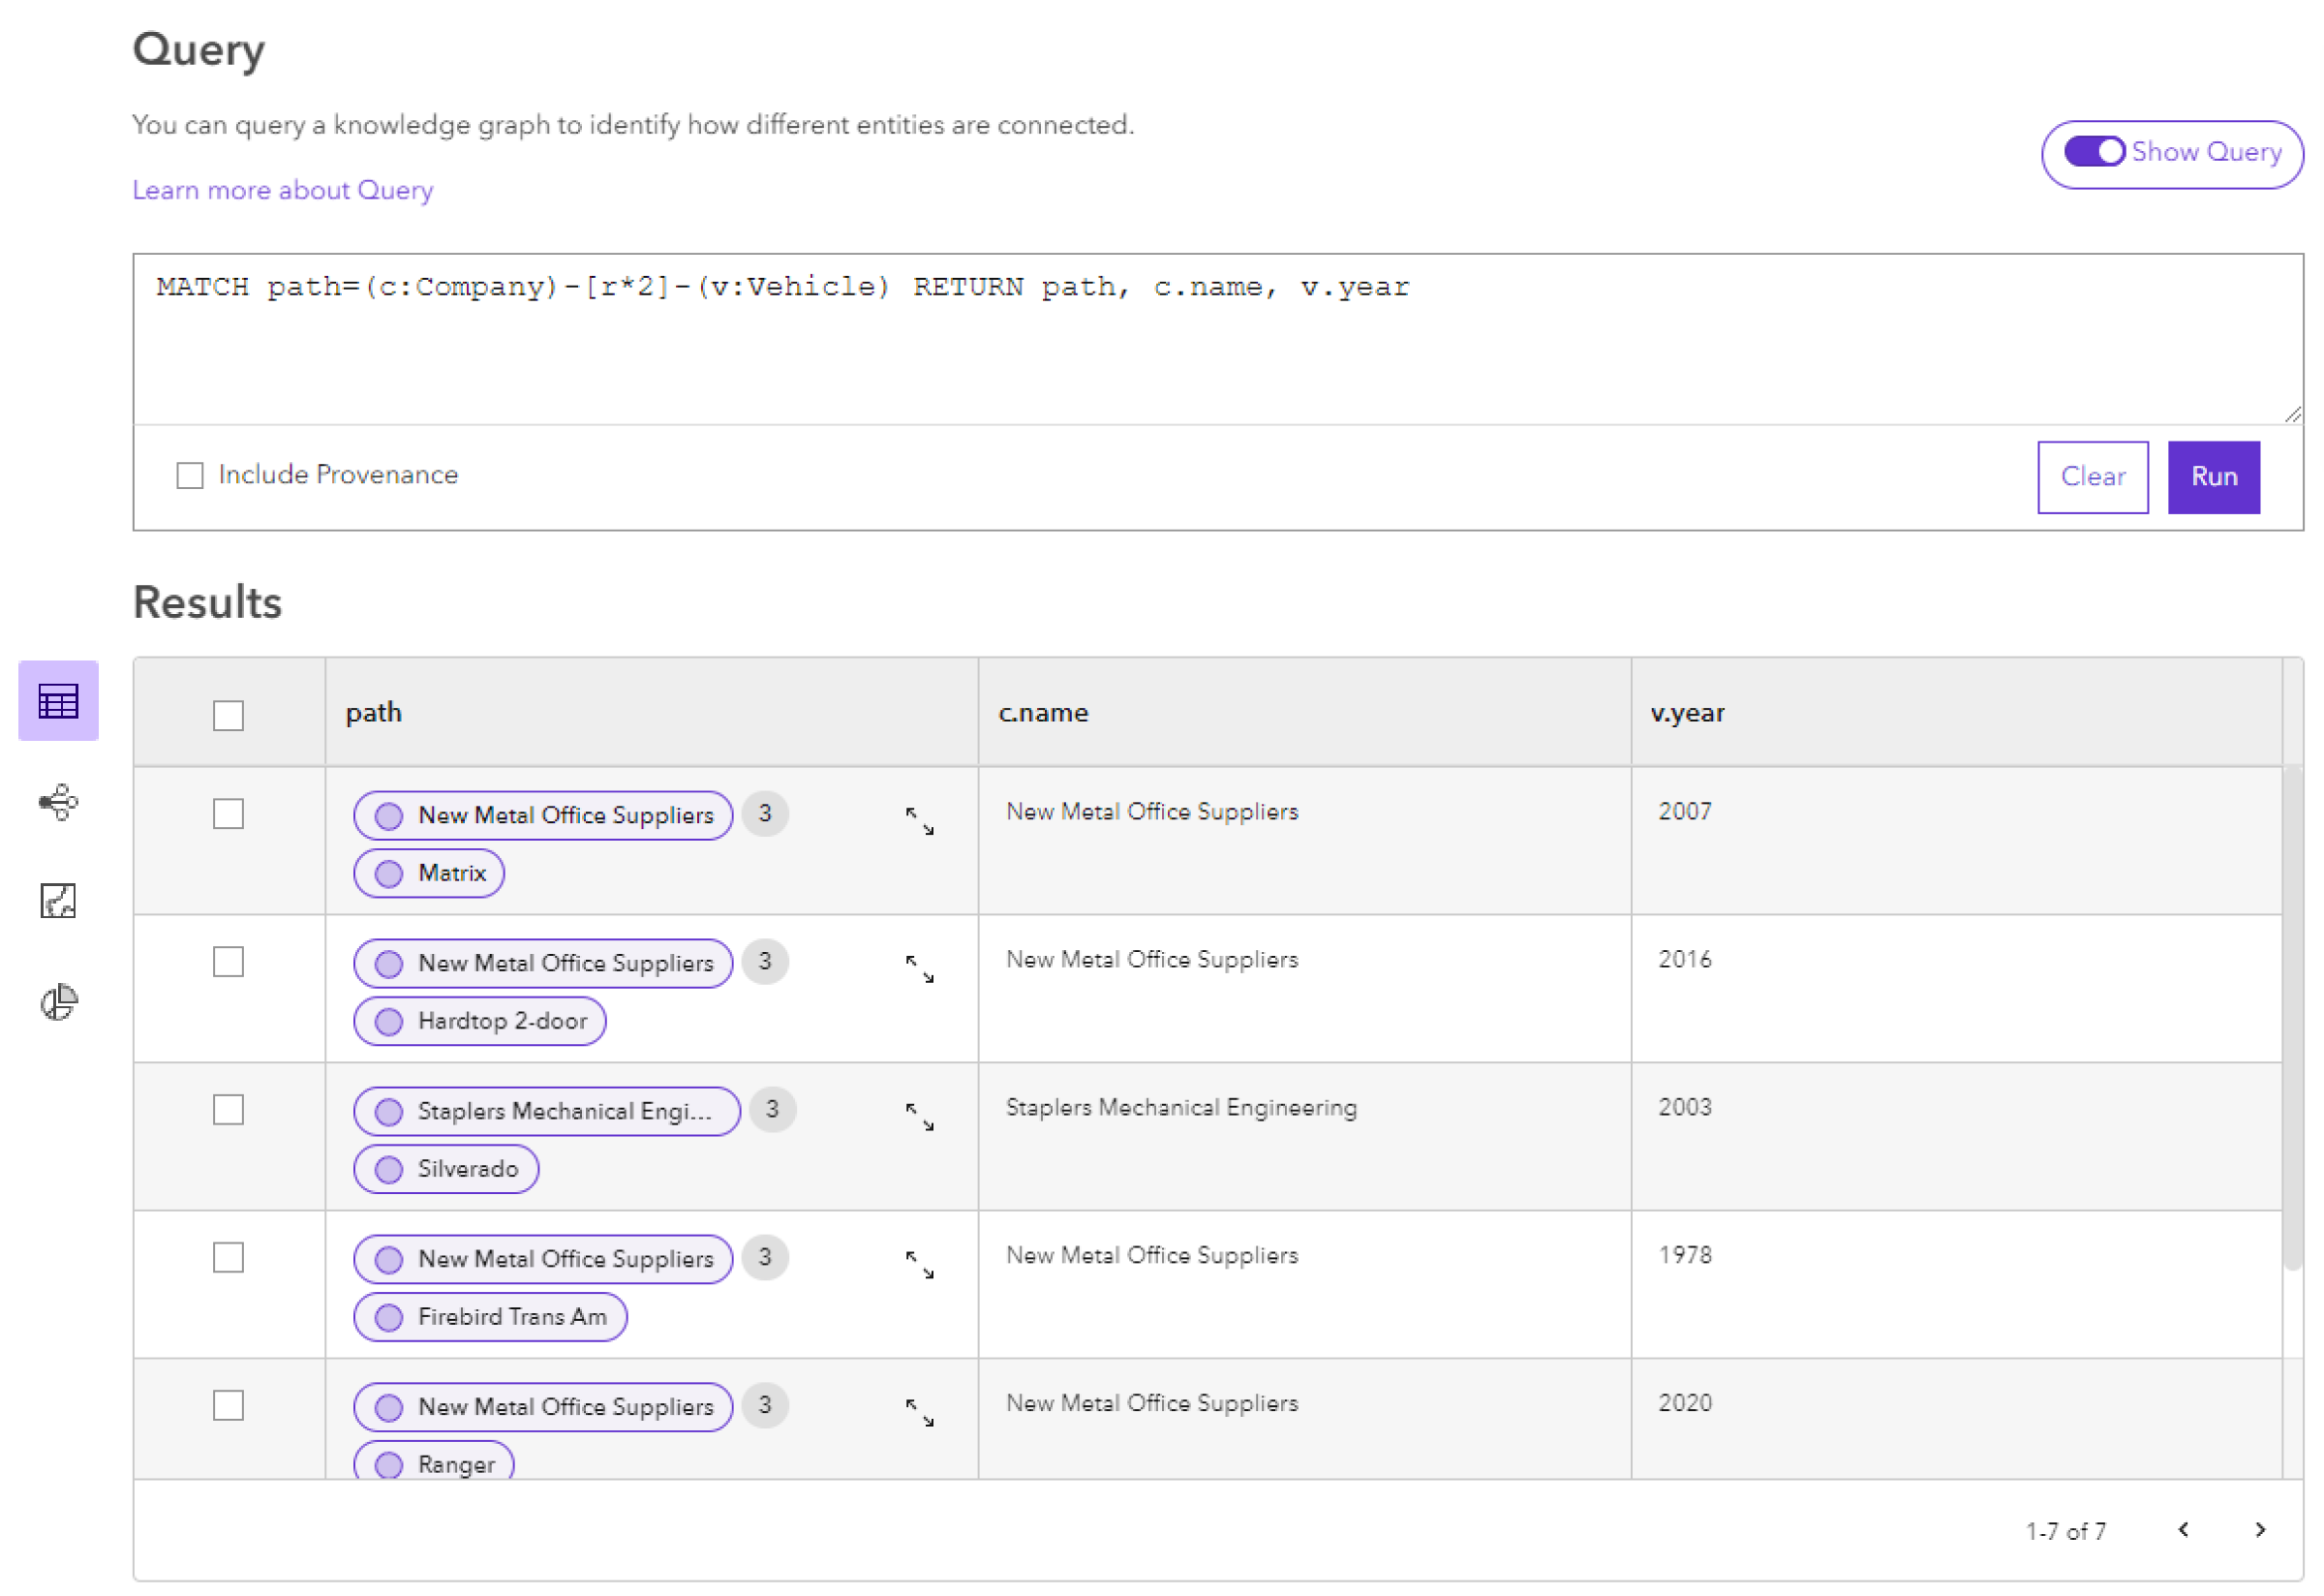
Paths can include any number of entities and relationships. For example, a query such as MATCH path=(c:Company)-[r*2]-(v:Vehicle) RETURN path will return all paths between Company entities and Vehicle entities that are exactly two relationships away. Each path will contain the origin Company entity, each intermediary entity and relationship, and the destination Vehicle entity. By default, it will just display the origin entity and destination entity in the path and the total number of records in the path. Click the Expand ![]() to view the full path result.
to view the full path result.
Paths can be returned as one element of a query result. For example, the same query can return the path and the name of the origin company and the year of the destination vehicle. MATCH path=(c:Company)-[r*2]-(v:Vehicle) RETURN path, c.name, v.year.
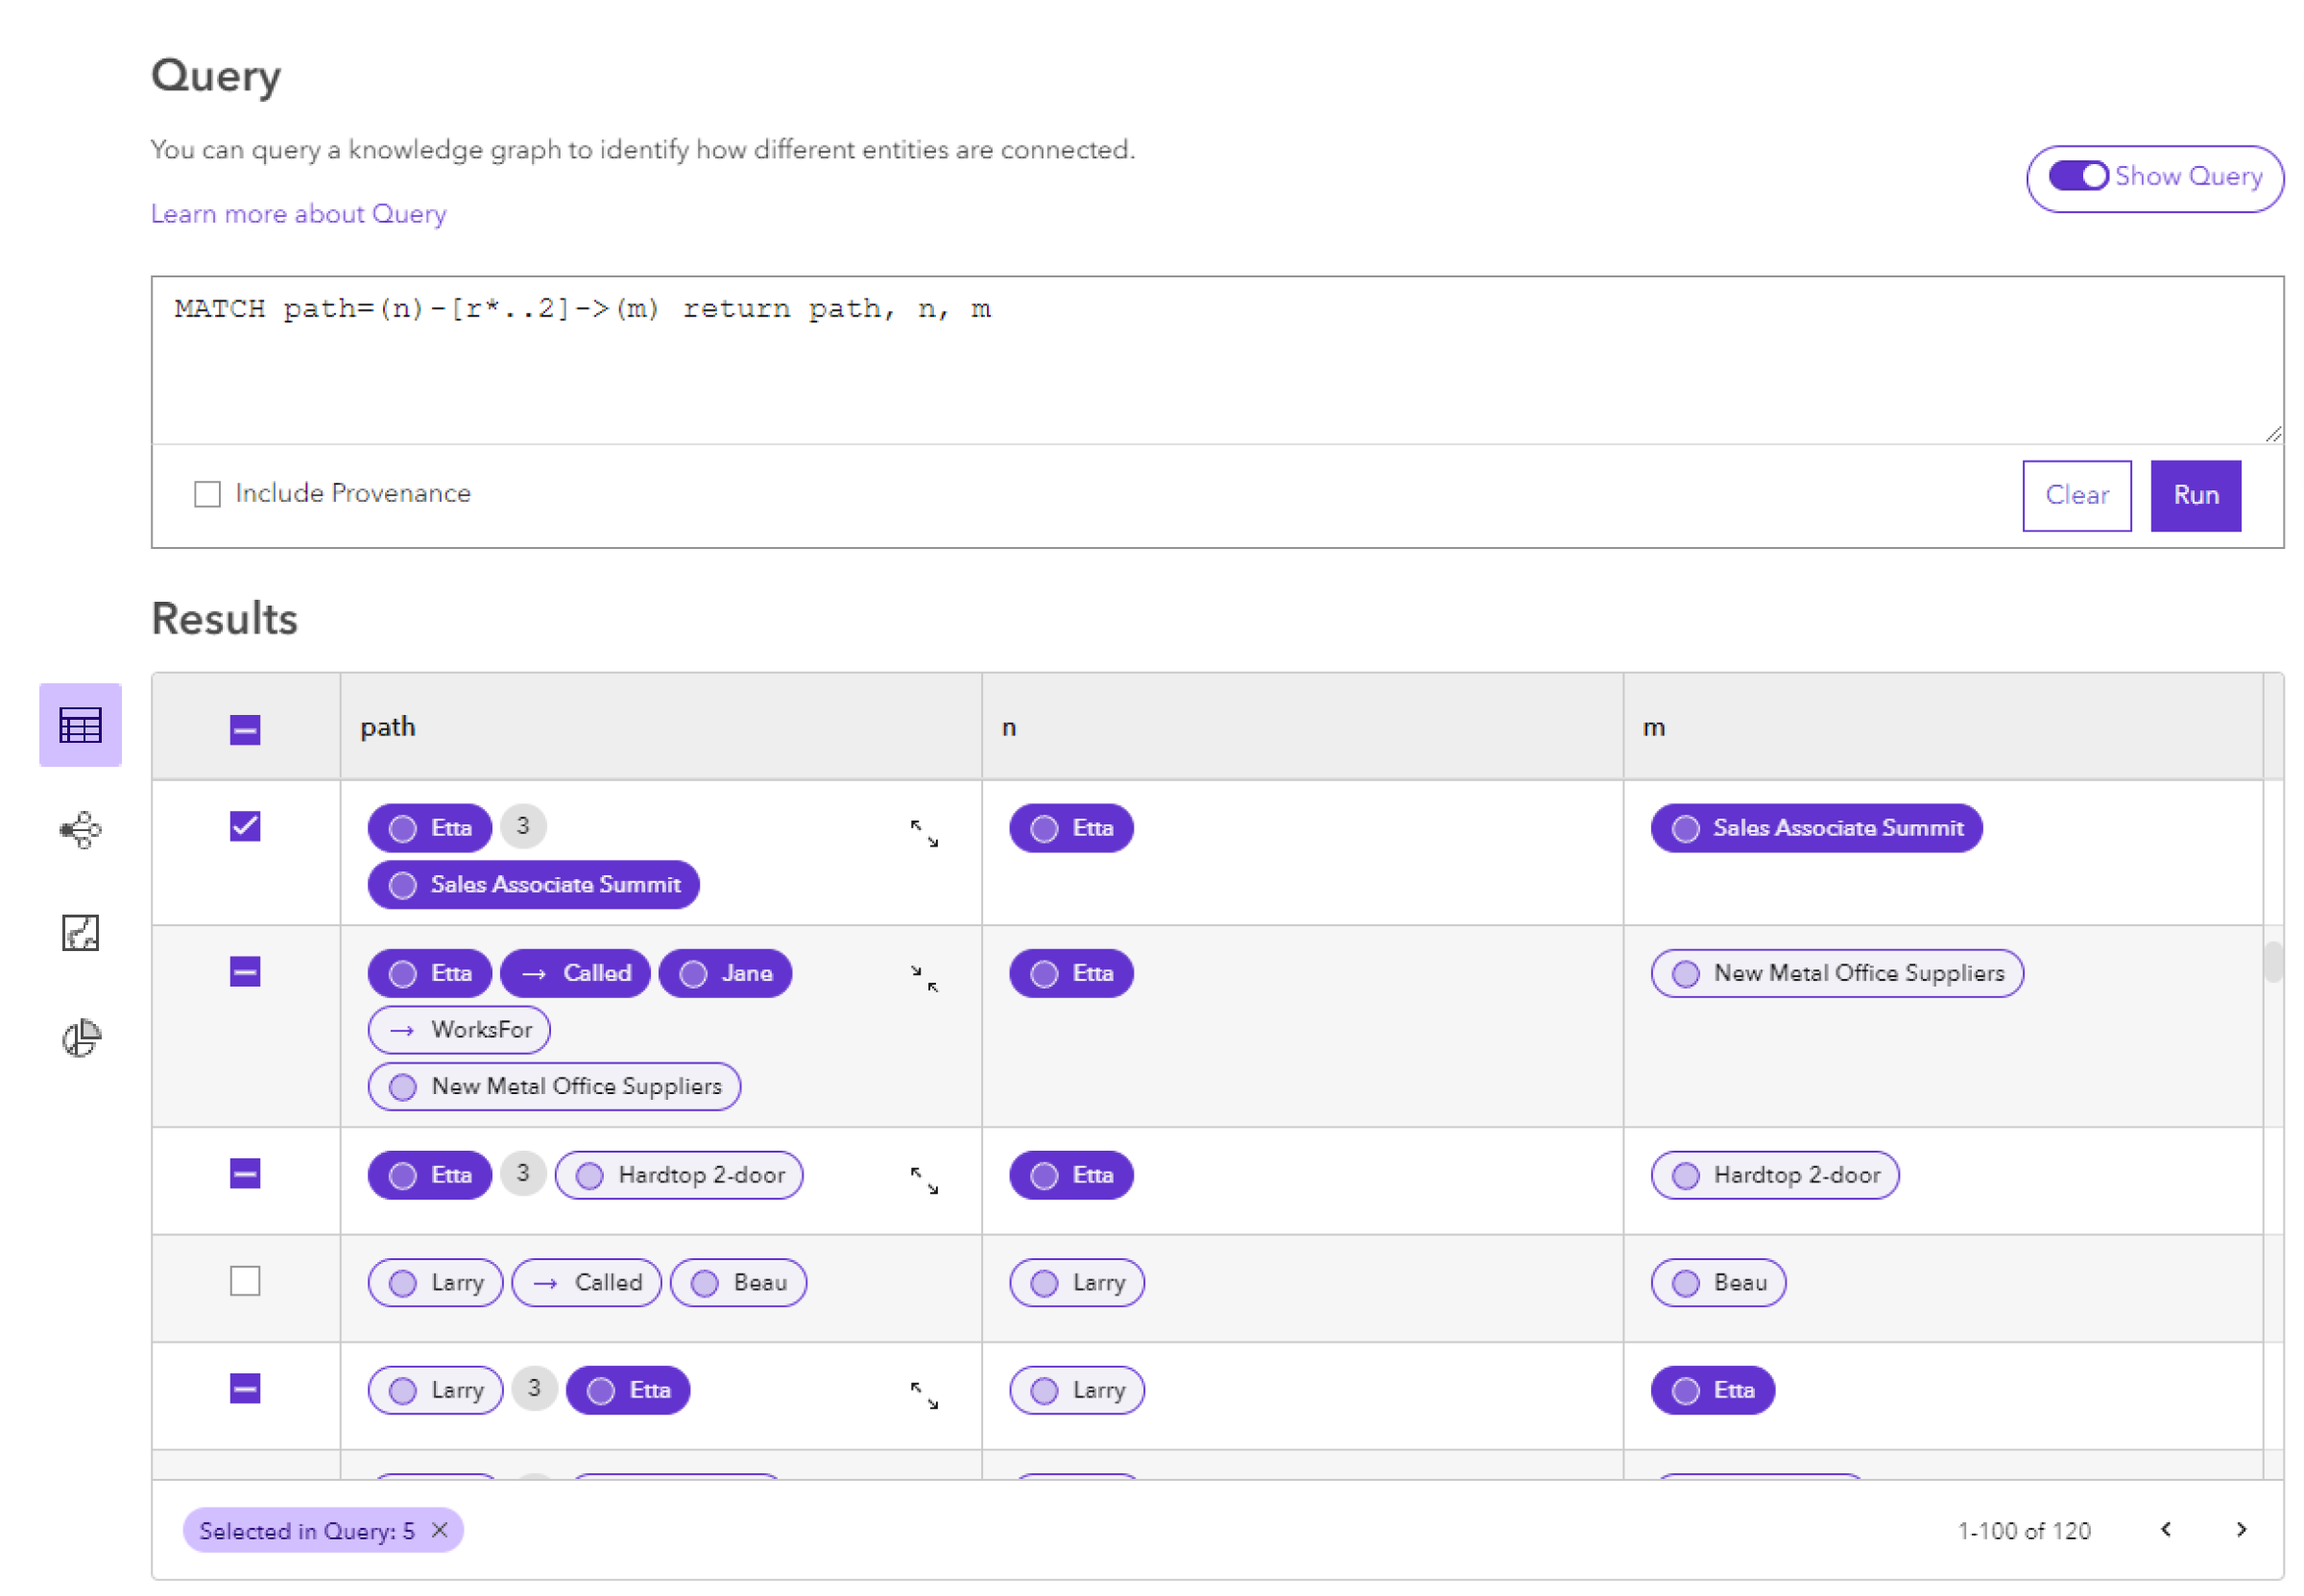
All query results are displayed in the table view by default. In this view, you can select query results, and view the properties of any entity or relationship returned from the query.
Click an entity
 or a relationship
  in the results table to see it's properties.
Optionally, use Add To
 to add this record to another content item.
Click the checkbox in the first column to add all of the entities and relationships in that row to your selection.
The entities and relationships in this row will be highlighted. Any instances of those entities and relationships that appear in other result rows will also be highlighted. The total number of selected records is displayed at the bottom of the table.
Optionally:
Press Ctrl while clicking an entity
or relationship to add just that record from your selection.Click the checkbox in the header of the first column of the table to select all records returned from the query.
Click the checkbox in the first column to remove all of the entities and relationships in that row from your selection.
Optionally:
Press Ctrl while clicking an entity
or relationship to remove just that record from your selection.Uncheck the checkbox in the header of the first column to deselect all records returned from the query.
Use the Add To
in the query context toolbar to add your selected records to a link chart, map or data card.Use the Selection Manager to manage selected records across queries in the query view.
Preview the results in a map or link chart
You can also use the query results map preview and query results link chart preview to preview the results of your query in a different visualization. Any selections made in the table view will be reflected in the map preview and link chart preview. You can modify the selection from the map or link chart preview using the interactive selection tools.
Click the Map view
 in the results menu to see a preview of the spatial entities returned by your query.
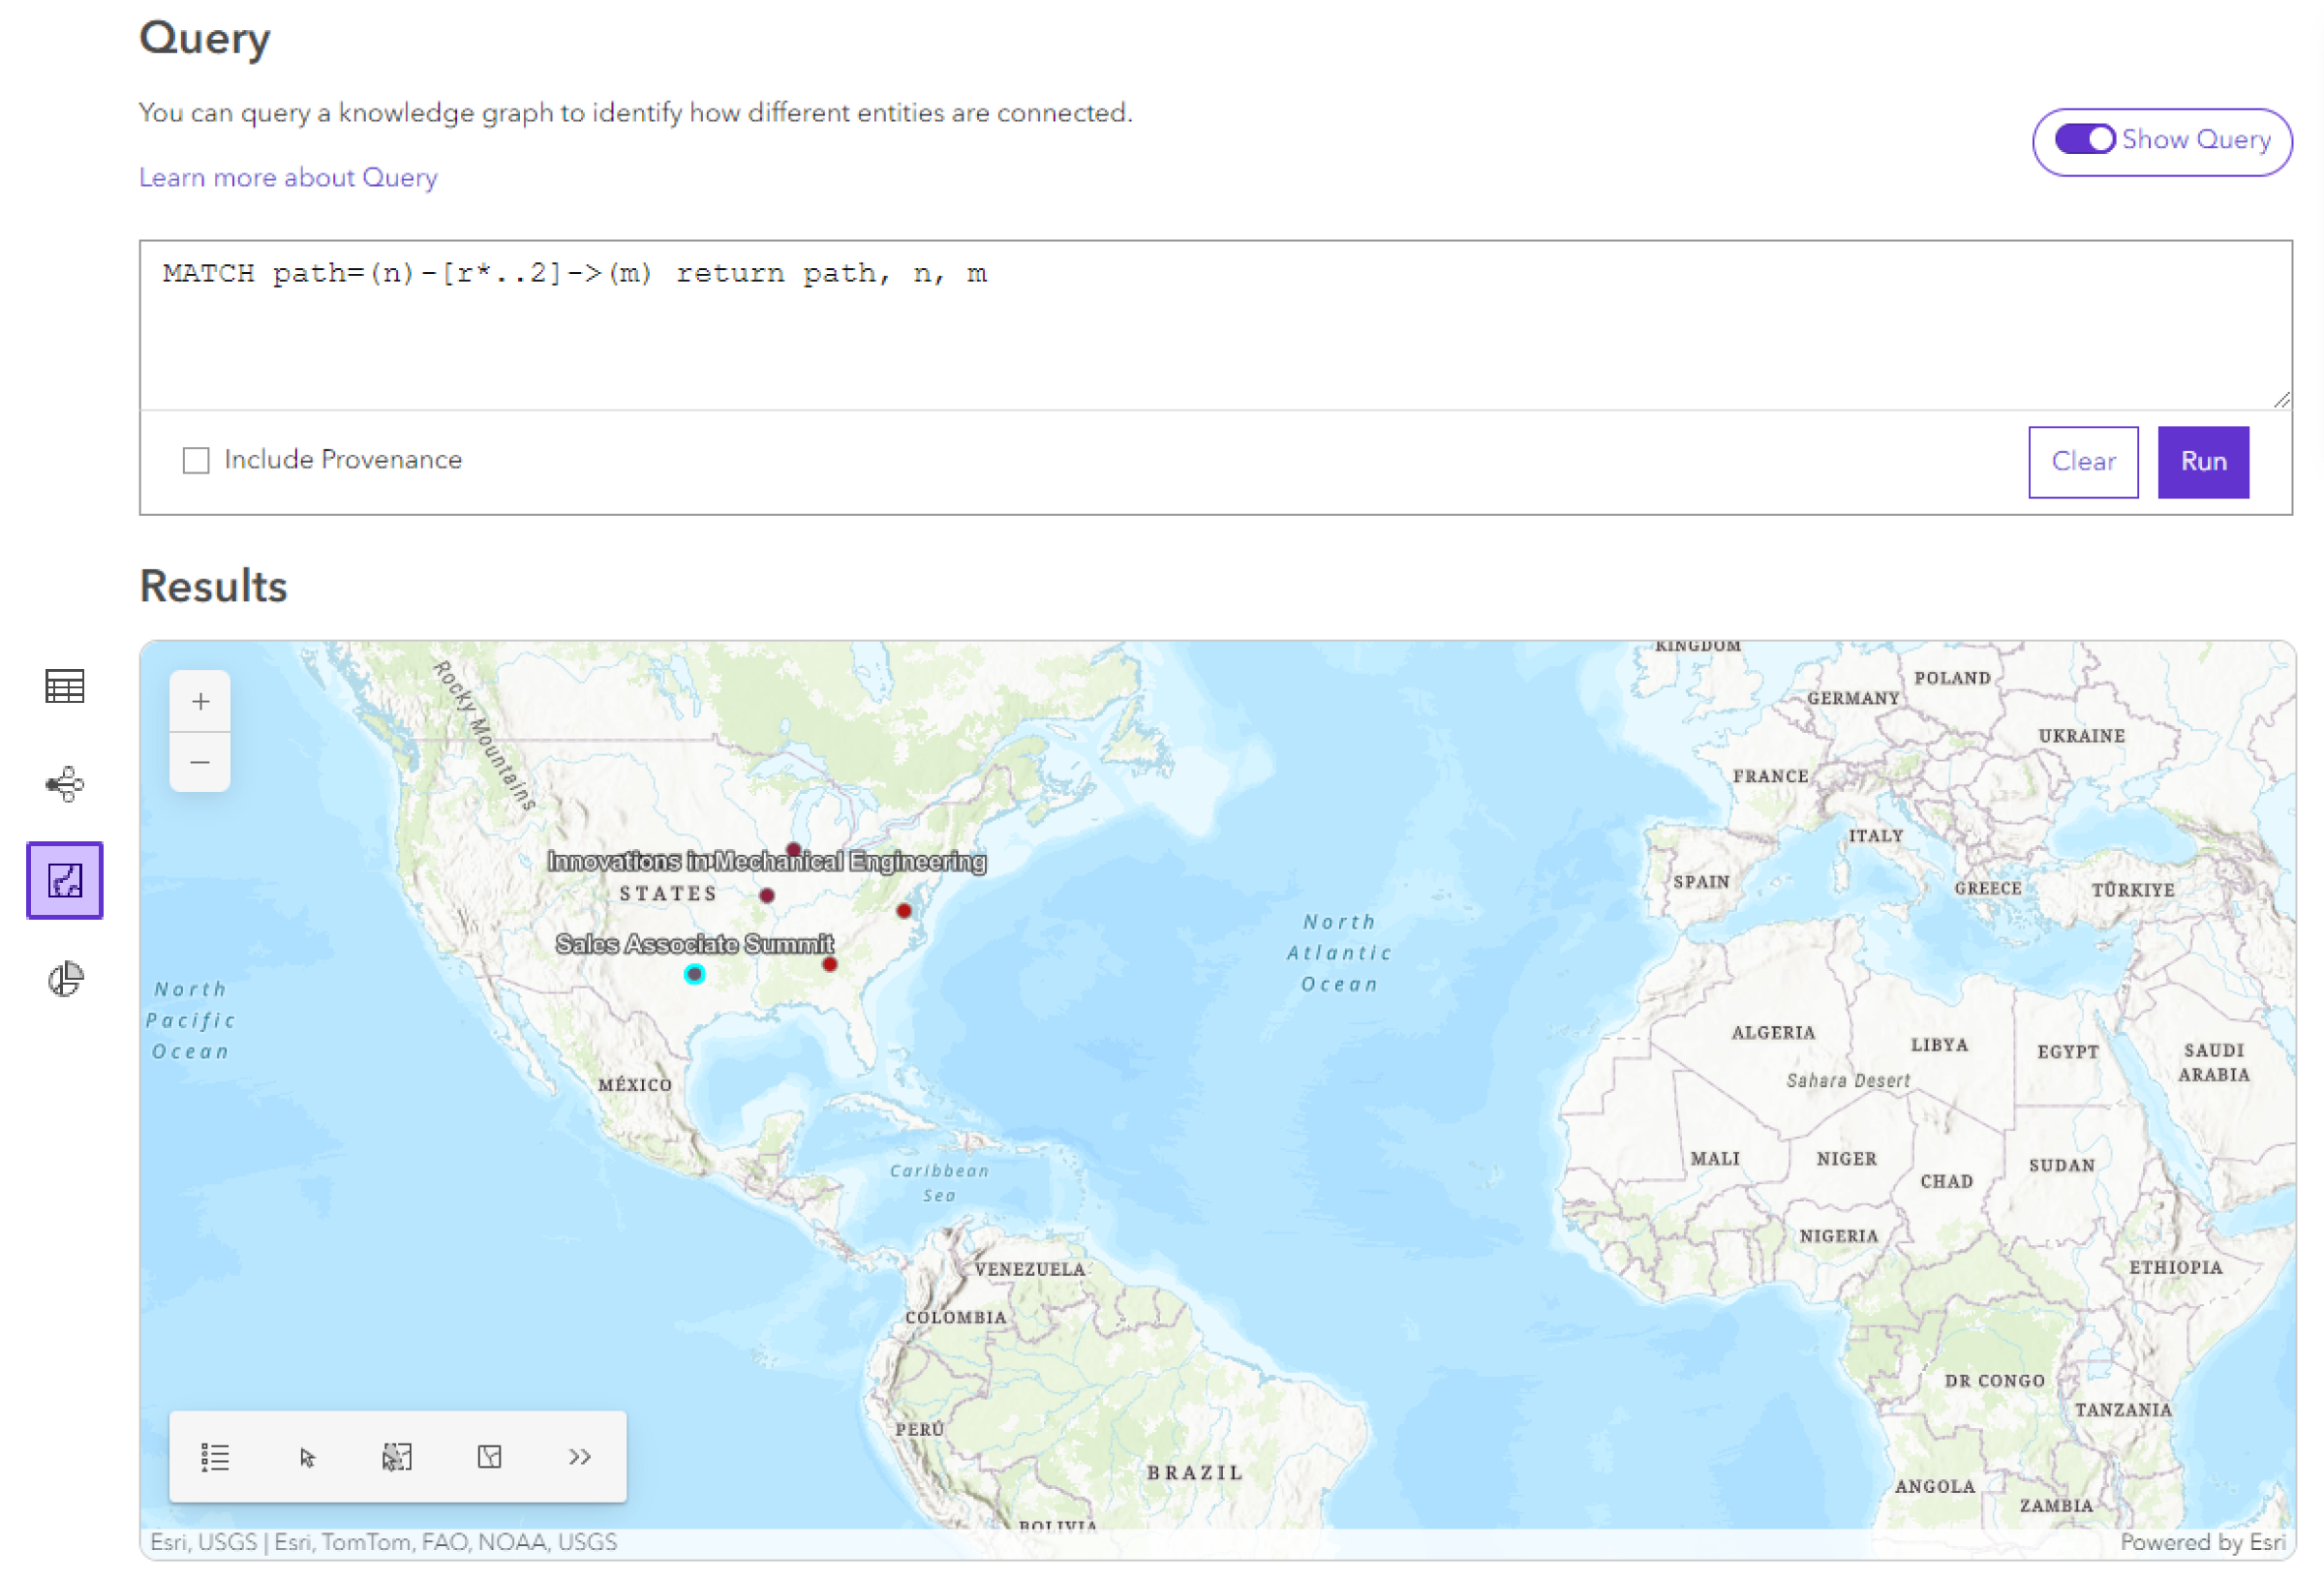
Optionally, modify the selection in the map using the interactive selection
Click the Link Chart view
 in the results menu to see a preview of your query results visualized in a link chart.
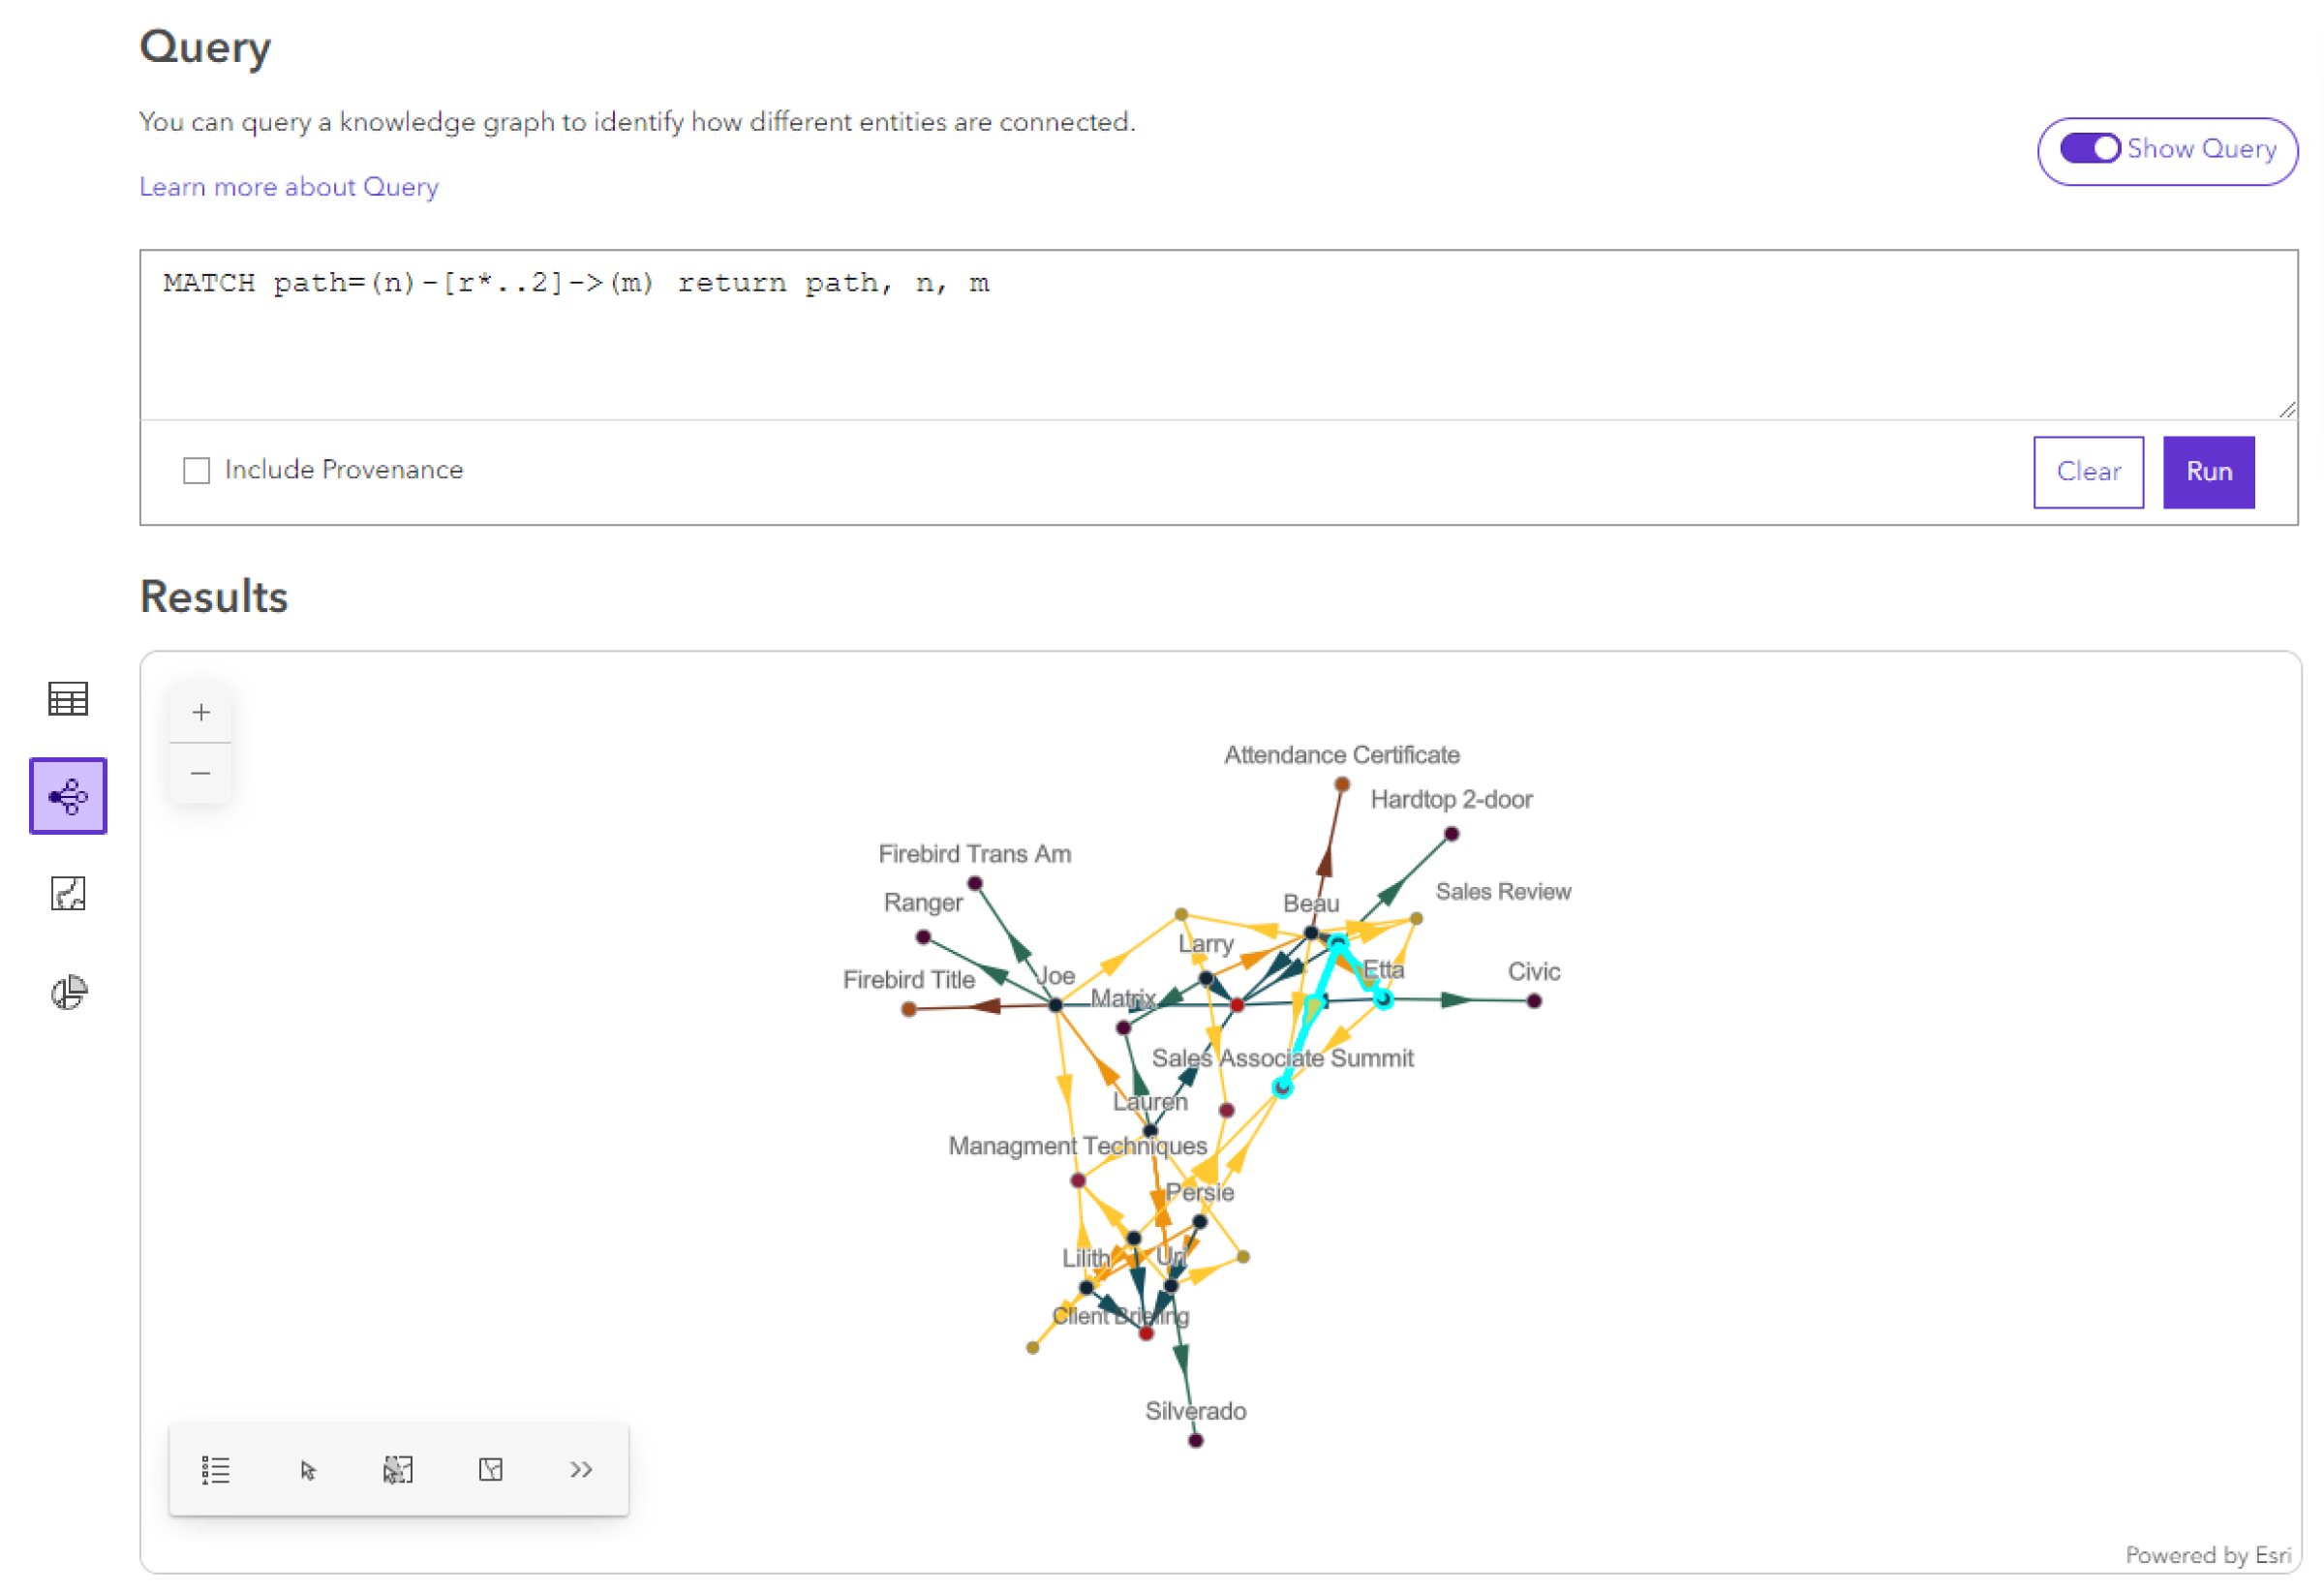
Optionally, modify the selection in the map using the interactive selection
Click the Table view
 in the results menu to return to the results table.
Use the Selection Manager to manage selected records across queries in the query view.
Preview query results with a chart
You can also use the charts view to visualize your query results in different ways. You can configure several types of charts that visualize characteristics and relationships from your query results. You can also choose how to aggregate the query results in your chart. You can select results in your chart and add them to a map or link chart. Chart configurations are not included in stored queries.
The following chart types are supported in Knowledge Studio:
| Chart | Description |
|---|---|
| Bar charts group data by categories along the x-axis. Use a bar chart to summarize and compare categorical data. | |
| Box plots display the distribution of one or more numeric attributes. Use a box plot to visualize and compare the distribution and central tendency of numeric values through their quartiles. | |
| Heat charts visualize data using a matrix of colored cells. Use a heat chart to visualizing correlations, density, or patterns between categorical variables. | |
| Histograms visualize the distribution of a numeric attribute. Use a histogram to visualize the distribution of values in a numeric variable by grouping numbers into bins and measuring the frequency of those groups. |
Configure a chart to summarize your query results.
Click the Charts view
 in the results menu.
Under Chart Settings select a Chart Aggregation method.
Click the Chart type dropdown and select the type of chart to create.
Configure the chart parameters.
Click Apply.
The chart appears in the chart view.
Optionally, select results in your chart.
In the context toolbar, click Add To
, and click the appropriate option to add your chart selection to a map or link chart.Under Add to new, click Map
to create a map in the project.Click Map from Template
 under Add to new and select the map to use as the template. Click Add.
Under Add to new, click Link Chart
to create a link chart in the project.Click Link Chart from template
 under Add to new and select the link chart to use as the template. Click Add.
Under Add to existing, click the name of an existing map or link chart.
The selection is added to the map or link chart.
Work with chart aggregation
Chart aggregation settings allow you to configure how a chart will organize and preview your query results. It will also determine how selections made on your chart are reflected in the the table view. Chart aggregation methods are described below:
Table Rows—Uses the rows and columns from the query results table. When an entity or relationship is returned in a column, its properties can also be used for charting. Selections made in your chart will apply to the entire rows in the table view that are used in the chart selection. If entities and relationships are returned in a row that is selected, they will be selected wherever they appear in the table view.
Entities and Relationships—Uses only the unique entities and relationships from your query results, grouped by their type. Their properties become the fields available for charting. Selections made in your chart will apply only to the individual entity or relationship in the table view, disregarding the row or column they were returned in.
The chart aggregation method allows you create a visualization of query results in different ways without the need for a new query. For example, the openCypher query below finds supply chain paths connecting a specific Supplier to both Plants or other Suppliers one to four hops away using multiple relationship types. It then aggregates the cost of all Part entities along each path, and returns both the path and a total cost.
MATCH path=(supplier:Supplier)-[:supplies|:raw_supplies|:produces|:purchased_by*..4]-(facility)
WHERE (facility:Plant OR facility:Supplier)  and supplier.globalid IN $supplier
WITH nodes(path) AS allNodes, path, supplier, facility
UNWIND allNodes AS node
WITH node, path, supplier, facility
WHERE node:Part
WITH ROUND(SUM(node.COST) * 100) / 100.0 AS totalCost, path,  supplier, facility
RETURN supplier, facility, totalCost, path
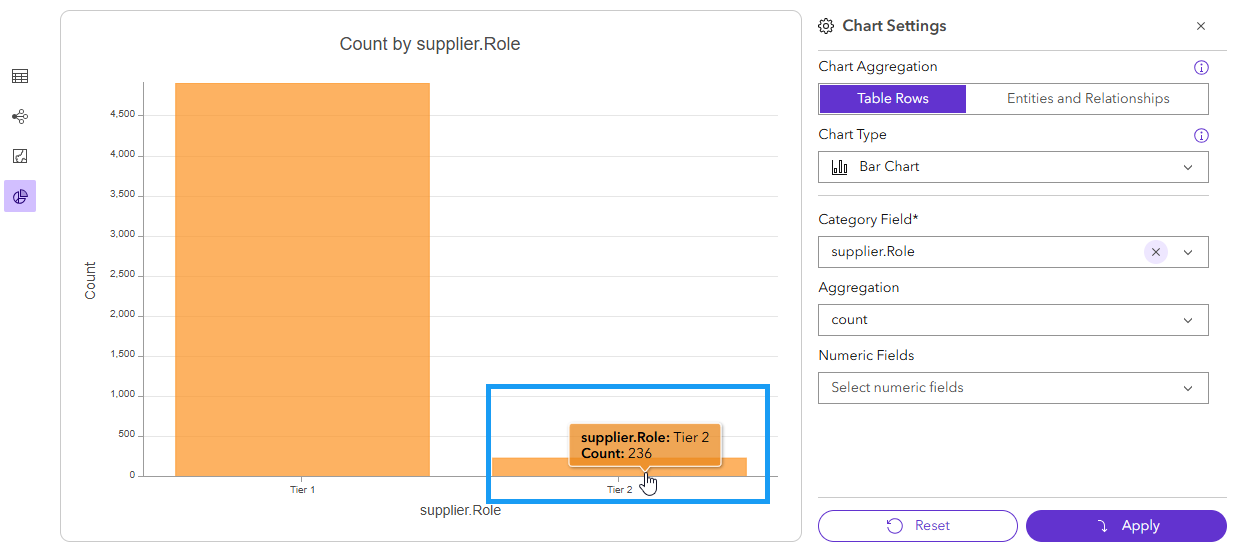
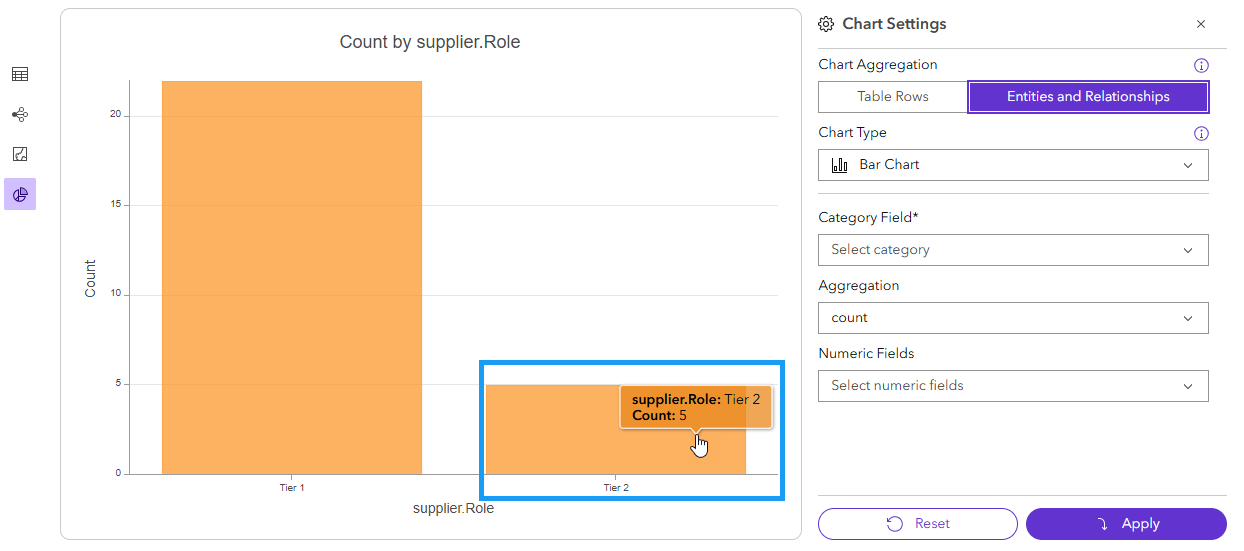
Using this query to visualize supplier roles in a bar chart presents different information--answering different questions--based on the chart aggregation method. Additionally, the selections made on the chart will change based on aggregation method. The below screenshots compare the results returned in the charts view:
The table rows aggregation method returns the number of different paths or networks that originate with a supplier of each role. If a supplier is the origin of many different paths, each path will be counted for that suppliers role. Selecting a bar will select all the entities and relationships in the table row where the origin supplier is of that tier, including any other parts, plants or suppliers in the path.
By contrast the entities and relationship aggregation method returns the total number of distinct suppliers of each type returned anywhere in any of the paths, independent of the table rows returned in the query result. Selecting a bar will only select the individual suppliers of that role.
By using different aggregation methods, you can determine how entities and relationships are represented in the charts view to answer different questions.