Get started with Map Viewer
Map Viewer is a map-making tool in ArcGIS that you can use to create, explore, and manage web maps.
A web map is an interactive display of geographic information that you can use to explore patterns, communicate findings, and answer questions. Web maps contain a basemap, a set of data layers (many of which include interactive pop-ups with information about the data), an extent, a legend, and navigation tools to pan and zoom.
Using Map Viewer, you can explore maps that others have shared, or sign in to create your own by adding data, styling layers, configuring pop-ups, analyzing data, editing features, and sharing the result. The map updates as you work, allowing you to see the effect of each change in real time.
What you can do in Map Viewer
Map Viewer provides a wide range of tools for creating and working with web maps. With Map Viewer, you can do the following:
Create and interact with maps—Choose a basemap, add layers from different sources, and draw sketch features. Navigate the map by panning, zooming, and rotating. Filter data, measure map areas, get directions, and click features or imagery to view pop-ups containing information about the data.
Visualize data—Use smart mapping styles and effects, aggregate high-density data, and configure pop-ups and charts. Write custom ArcGIS Arcade expressions to control styling, pop-ups, and labels. Configure time-enabled layers, or configure a time series from sequential time fields.
Perform analysis—Run analysis tools, including raster and imagery analysis. Build models with ModelBuilder and publish them as custom web tools.
Manage data—Edit features with editing templates, including shared templates. Add and delete fields and calculate field values. Configure forms for attribute editing.
Share maps—Use the Review map tool to verify that a map and the layers within it are optimized to support high usage levels. Print maps using custom layout templates and dynamic legends, and share maps as links or embed them in websites and in apps.
Map Viewer design
Map Viewer has an intuitive design that allows you to view and manage content in one dedicated area and to customize and configure a map in another area. The following sections provide an overview of the Map Viewer interface.
Map Viewer includes two vertical toolbars—the Contents (dark) toolbar and the Settings (light) toolbar. Use the Contents toolbar to manage and view the map contents and work with the map. Use the Settings toolbar to access options for configuring and interacting with map layers and other map components.
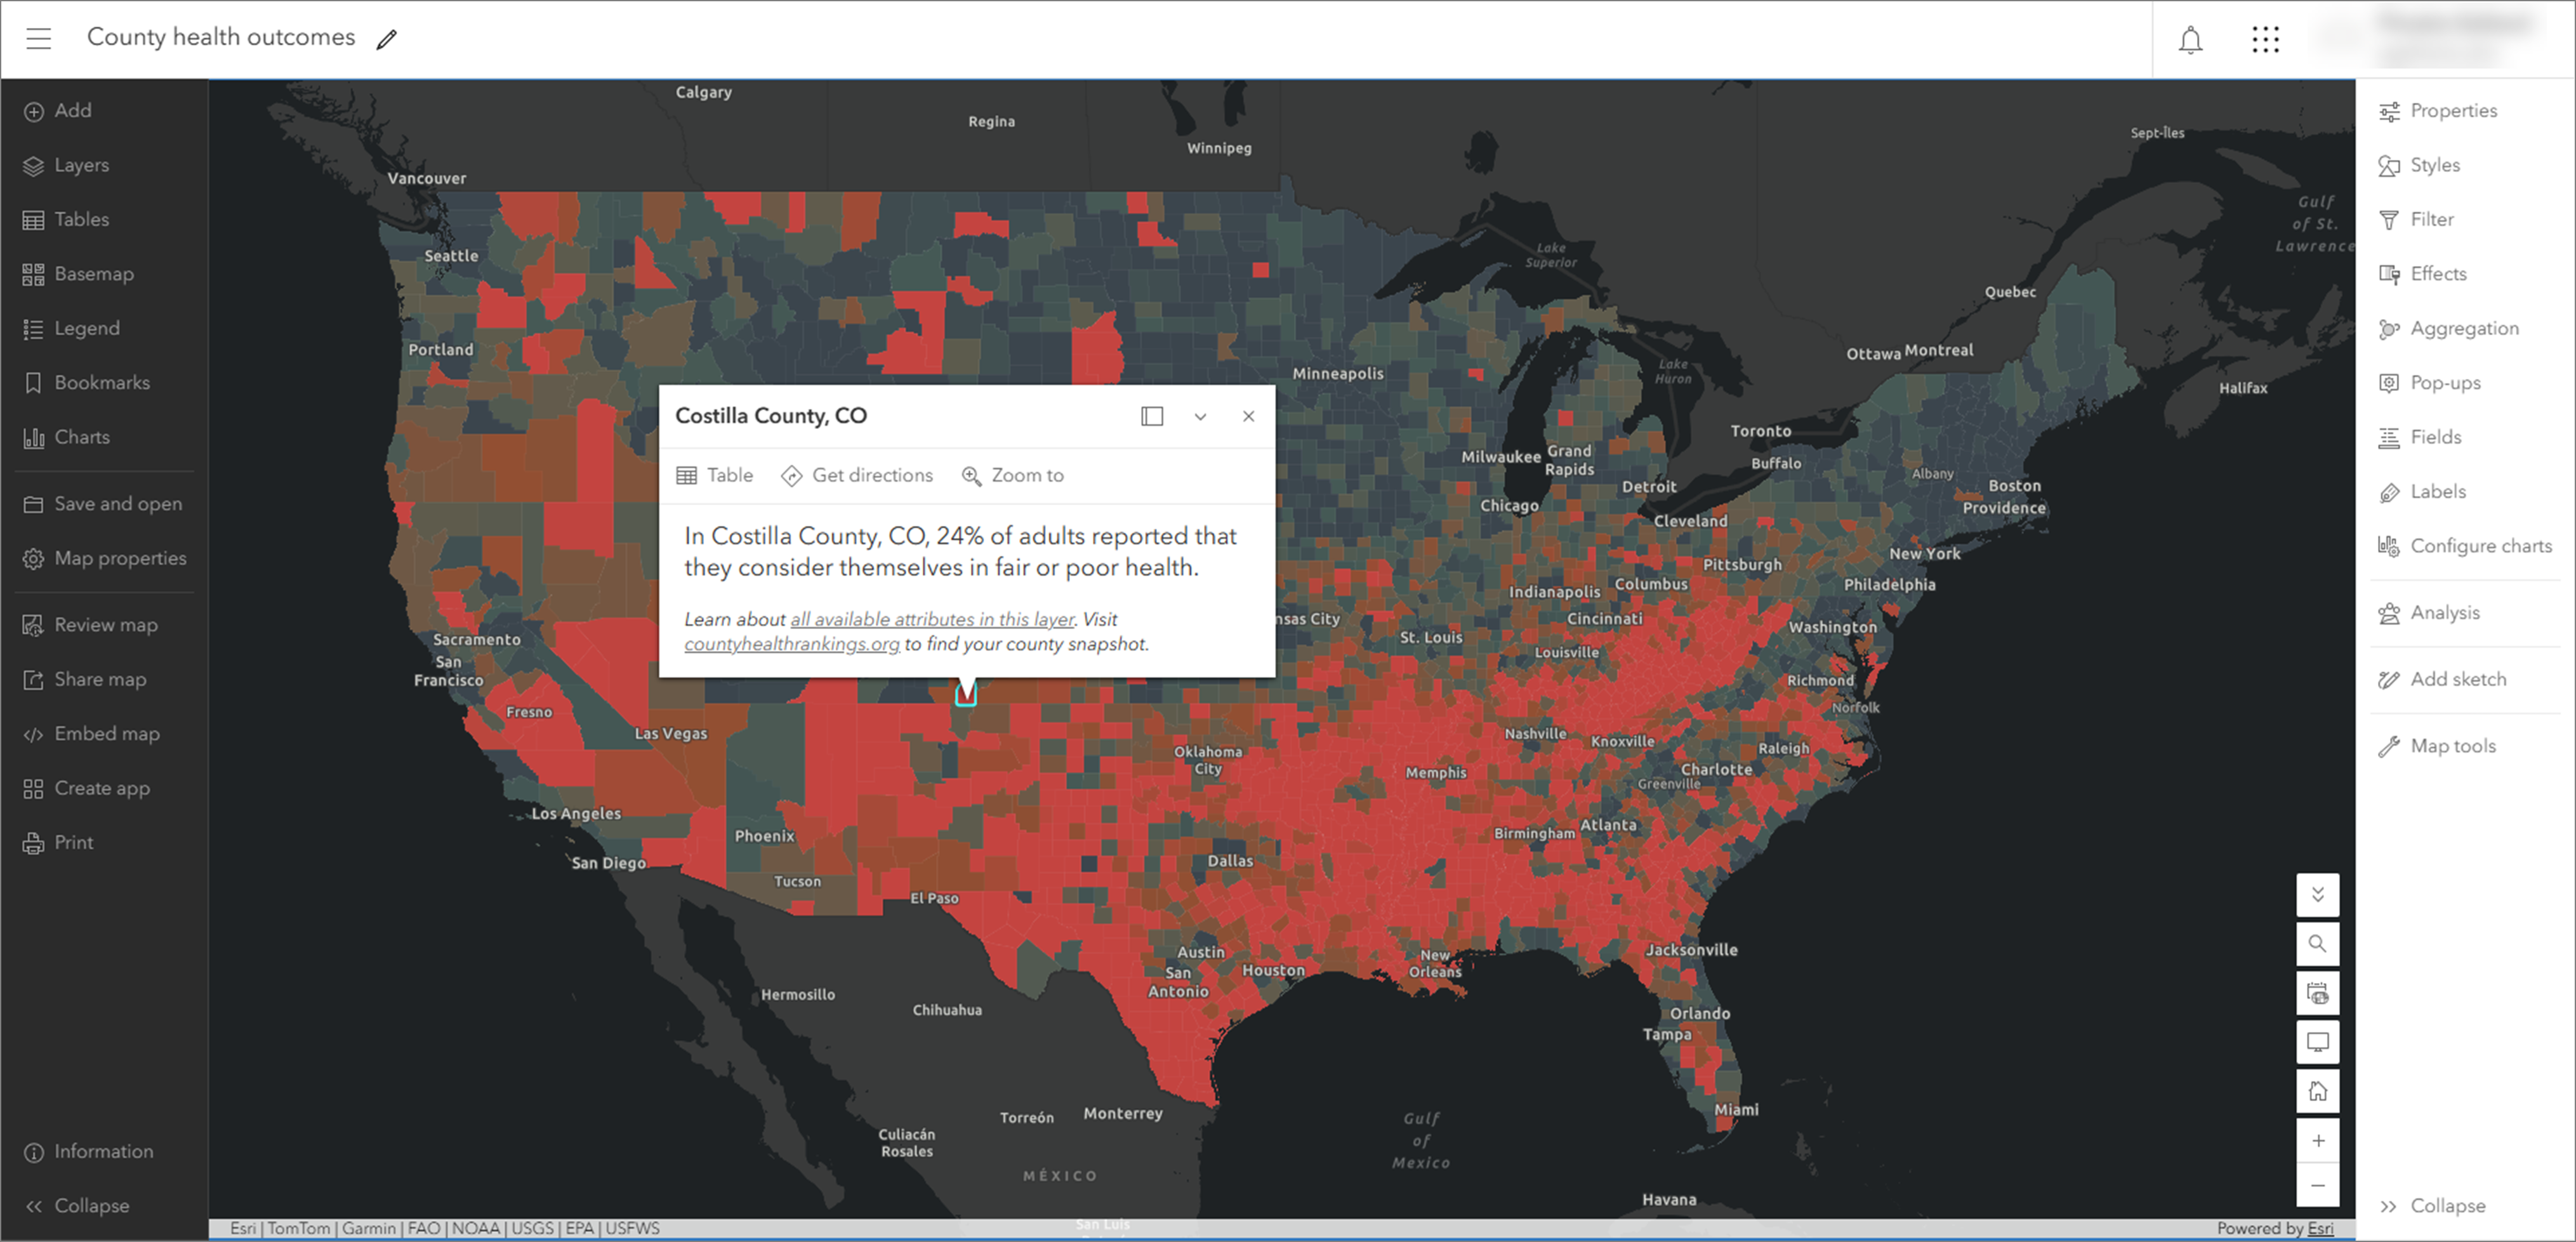
Use the Expand and Collapse buttons at the bottom of each toolbar (for example,  and
 on the Settings toolbar) to expand or collapse them. You can also use the Hide interface button
 on the map to collapse both toolbars at once and maximize space to work with the map.
Contents toolbar
Manage and view key components of the map using the Contents (dark) toolbar buttons. For example, you can change the basemap and add layers. Click the Layers button  to see what layers are in the map.
Note:
You can explore maps, add and configure layers, and more without signing in. To save your work, sign in before creating a map.
Layers in the map are drawn in the same order in which they appear in the Layers pane. You can organize layers to draw in any order and click Hide layer  or Show layer
 to hide or show, respectively, individual layers. You can also click Options
 to expand the list of options for the layer and view the layer's properties.
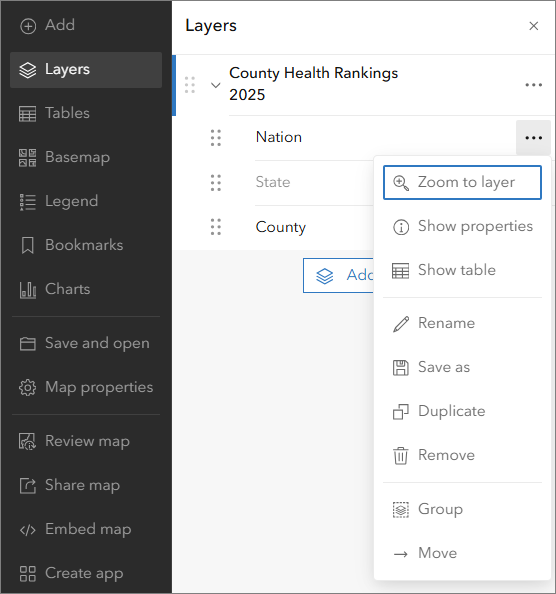
If the map contains a group layer, you can display one specific layer from that group without individually showing or hiding the other layers. To do this, turn on or turn off the Exclusive visibility toggle button.
Some layers have symbology that appears in a legend. View the Legend pane to see how the data layer is represented on the map.
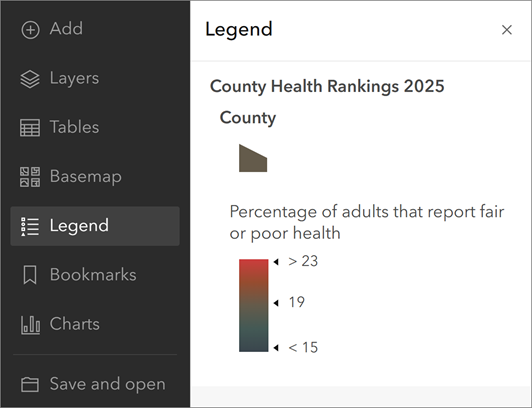
You can also use the Contents toolbar to perform actions such as opening, saving, sharing, and printing maps. Use the Information button to learn what to expect in future updates.
Settings toolbar
The Settings (light) toolbar includes options for working with individual layers in the map, as well as options for working with the map itself. Select a layer in the map to access the layer options on the toolbar. You can use the selector at the top of the active pane to quickly switch layers.
Layer options are at the top of the Settings toolbar. The layer options displayed depend on the type of layer selected and, in some cases, the data contained in the layer. For example, the Clustering button is only displayed when a feature layer containing point features is selected.
Use the Settings toolbar to configure pop-ups, filters, clustering, labels, and more. Your changes are instantly visible on the map, allowing you to experiment and explore various options. Click the Styles button  to explore smart mapping styles, such as dot density and heat map. You can try different symbols and color ramps for features and imagery in the map.
Some buttons on the Settings toolbar allow you to interact with and get new information from the map. These buttons are displayed at the bottom of the toolbar. You can search for locations, measure distance or area, view time-enabled data, get directions, and find geographic coordinates.
 Next steps
To follow the foundational workflow of choosing a basemap, adding layers, applying styles, configuring pop-ups, and saving your map, see Get started creating maps.
Play the mapping basics video for tips about how to get started in Map Viewer.
Try the tutorial Create a policy map to address health conditions to learn more about creating maps.