Search points of interest
![]() Available with Business Analyst license.
Available with Business Analyst license.
You can search points of interest (POI), such as businesses and facilities, using data from Data Axle, SafeGraph, Foursquare, and other POI data sources. For example, you can search for hospitals or search using the name of a specific hospital. You can also search within a category or industry, or search using codes.
Note:
To learn about data in Business Analyst, visit the data documentation:
For information about the online datasets included with Business Analyst, see ArcGIS Data vintages. Performing a points of interest search consumes credits when the Business Analyst data source is set to an online data source.
For information about local datasets available for use in Business Analyst, see the latest local data documentation.
Potential use cases
The following are potential use cases for the points of interest search workflow:
| Application | Description | Examples of data used |
|---|---|---|
| Event planning | An event planning company is assessing hotels their clients may be interested in. They perform a points of interest code search in their area of interest, using the primary NAICS code for hotels. They adjust the search to hotels that also house event spaces, using all NAICS codes, capturing secondary codes for event spaces in their search. | NAICS code 72111002 (Hotels & Motels) |
| Site selection | A grocer is interested in establishing a location in a new city. To assess the business potential in the area, they create a color-coded layer showing current and future spending on food. They use a points of interest search to assess the competitive landscape by mapping other grocery stores in the area. They then create trade areas using their point layer of potential locations in this area and run a business summary infographic for each. | NAICS code 44511003 (Grocers-Retail) |
| Nearby analysis | A company is seeking a new location for an office building. Their real estate analyst uses points of interest search to assess whether there are adequate amenities—such as restaurants, stores, and daycares—to support the company's employees at the location. | Data Axle Categories:
|
Perform a points of interest search
Before starting a search, set the Business Analyst data source. The options available in the points of interest search workflow are dependent on the Business Analyst data source.
To search for points of interest, complete the following steps:
On the Analysis tab, click Business Analysis to open the gallery, and click Points of Interest Search.
The Points of Interest Search workflow pane opens.
Optionally, choose a POI data source.
Note:
The Points of Interest Search pane only shows the Data Source option when a Business Analyst data source contains more than one POI data provider. For example, if you are using the online United States (Esri 2025) data source, you can choose Data Axle, SafeGraph, or Foursquare as the POI data source.
Select a search type from the following options:
Keyword—Search using terms, such as coffee or dentist.
Category—Search, browse, and select categories and subcategories, such as Health or Hospitals. The categories available depend on the data source selected.
Code—Search, browse, and select industry codes, such as 4411 (Automobile Dealers).
All points—Search all points of interest in the search extent.
Advanced search—Create conditional statements to perform a search, such as Company name starts with Acme or Employee count is greater than 10. This search type is only available with online datasets.
For more information about these options, see Search types.
Define the search, according to the search type you selected:
If you selected Keyword, enter a search term in the Name or keyword field.
If you selected Category, enter a search term in the Category name field or browse the list of categories. You can expand categories to view subcategories. Use the check boxes to select categories and subcategories.
If you selected Code, use the Code type menu to choose an industry code system. Enter a search term or code number in the Code field or browse the list of codes. Use the check boxes to select codes.
If you selected All points, proceed to the next step.
If you selected Advanced search, build search condition statements to define the search.
For Search extent, select from the following:
Current Display Extent—Search for points of interest in the visible map extent of the project.
Area of Interest—Define a custom area of interest by doing either of the following:
Enter a location, such a city or state, and select from a list of standard geographies displayed in order of population. Click one or more standard geographies in the list to add them to the area of interest. You can remove areas of interest individually or click Clear all.
Use the Boundary Layer drop-down list
 to select a polygon layer from the Contents pane as the area of interest. You can use one polygon layer at a time.
For Search limit, enter a maximum number of points to return for the search.
Click Next.
The search results appear in the Points of Interest Search pane with options to filter the search.
Optionally, refine the search using keywords and attributes by clicking the Filter tab and doing the following:
Under By keywords, enter search terms to search within the results.
Under By attributes, browse the data’s attributes, such as business names, locations, and sales volumes. Available attributes vary depending on the data source. Do any of the following:
Use the check boxes to select attributes. Expand an attribute, hover over an option, or click Only to deselect all other options in the group.
Search within attributes to filter by keywords.
Expand numerical categories, such as Employee Count or Sales Volume, to define minimum and maximum values.
Click Reset to remove the filters you set.
Optionally, aggregate the search results to polygons on the map by clicking the Aggregate tab and doing the following:
Click Boundary, Geography, or Hexagon to select the geography type to summarize point data for.
Specify the level of detail:
For Boundary, select a boundary layer.
For Geography, use the Geography group drop-down list to select from different types of geography levels, then choose a level of detail to display.
For Hexagon, select a hexagon resolution. To learn more about hexagons, see Hexagons reference.
For Calculation, select the attribute to aggregate from the point data. For more information, see Aggregation calculations.
Visualize the results using the following options:
Depending on the dataset you selected, use the Style drop-down menu to choose Location or Place symbol style:
The Location style displays data using a single symbol to show feature distribution.
The Place style displays data using thematic symbols that represent the types of features on the map. Symbols may vary between datasets.
Use the Size parameter to define the size of point symbols.
Click Preview Map to see the results on the map. You may need to adjust your map extent to view the area of interest.
Click Preview Table to see the results in a tabular form. Select a row in the table to highlight the associated record on the map.
Specify the Output name.
Click Finish.
The workflow pane closes and a point layer with the results of the points of interest search workflow is added to the map.
Search types
The points of interest search workflow provides multiple search options. The following sections describe information relevant to different search types.
Keyword
Searching by keyword allows you to enter search terms, and offers the following options in the Options menu ![]() .
.
Choose Find related POI
 to perform a semantic search, returning a broader range of search results related to the search term you entered.
Choose Exact match to narrow the search results to exact matches only.
Choose Company name only to only return results that have the search term in the company or business name.
Category
Searching by category allows you to browse, search, and select within a category system that organizes points of interest records into industry-specific and thematic groups. The available category systems vary depending on the data source selected.
If enabled by the points of interest dataset and your installation options, this search type performs a semantic search. For example, you might search for pet shops and return the following results, depending on whether a semantic search was performed:
Without semantic search: The search yields results only for categories containing the words Pet Shops.
With semantic search: The search yields results in all categories related to pet shops, pet supplies, pet health, pet care, and more.
Code
Searching by code allows you to browse, search, and select within industry classification systems, such as the North American Industry Classification System (NAICS), that organize points of interest records into industry-specific and thematic code groups. The available classification systems vary depending on the data source selected.
Legacy:
In 2026, Business Analyst will transition to NAICS codes as a replacement for the legacy SIC system, which will be deprecated as a search option in the points of interest search workflow.
Points of interest records are often assigned a primary code, which represents the predominant business type at an address. They may also be assigned secondary codes representing multiple business types that are collocated at the address. For example, you might opt to search for a code representing event spaces, and return the following results with different code systems:
Primary code: The search returns all points of interest for which event spaces is the primary code.
All codes: The search returns all points of interest for which events spaces are any of the codes.
Build search condition statements
A search condition is a rule that filters your search results, providing more specificity to the search query. To build a search condition statement, you must select an attribute, choose a filter operator, and set a value.
For example, you can create conditions that filter your search to show businesses with more than 20 employees, or that are located in a specific state:
| Attribute | Filter operator | Value |
|---|---|---|
| Employee Count | is greater than | 20 |
| State Abbreviation | contains | PA |
To link multiple conditions or condition groups, use a logical operator to select whether all conditions or any of the conditions must be met:
The logical operator for all conditions to be true is represented by AND. Choosing all conditions means that the results must match each conditioned criterion.
The logical operator for any conditions to be true is represented by OR. Choosing any conditions means that the results must match at least one of the conditioned criteria.
Add conditions
To add conditions to a points of interest search, do the following:
In the Points of Interest Search pane, for Search type, select Advanced search.
In the Condition section, click Add condition.
Select a field from the drop-down menu.
You can select from categories, codes, text attributes, and numeric attributes.
Choose a filter operator from the drop-down menu.
There are different filter operators depending on the selected data source, the type of search (keyword, category, or code), and whether the field you selected is text or numeric.
Enter a value.
Optionally, click Add condition and repeat the previous steps to create additional conditions.
If you are using more than one condition, set the logical operator. Use the drop-down menu to choose either All of the following are true or Any of the following are true.
Click the Options button
 on a condition and do either of the following:
Click Delete to delete the condition.
Click Add to condition group to create a condition group.
To perform the advanced search, click Next.
Use condition groups
To create a more complex advanced search, use condition groups. Each condition group uses its own logical operator. Some condition groups may require that all of the conditions are true and others may require that any of the conditions are true. Furthermore, each condition group is logically related to one another. Either all condition groups are required to be true or any of the condition groups are required to be true.
Click the Options button
on a condition.Click Add to condition group.
A new group containing the existing condition and an empty condition appears.
Select a field, choose a filter operator, and enter a value for the empty condition.
To add conditions to the group, click the Options button
and click Add to condition group.Use the logical operator drop-down menu to choose either All of the following are true or Any of the following are true.
Optionally, repeat the previous steps to create additional condition groups.
Aggregation calculations
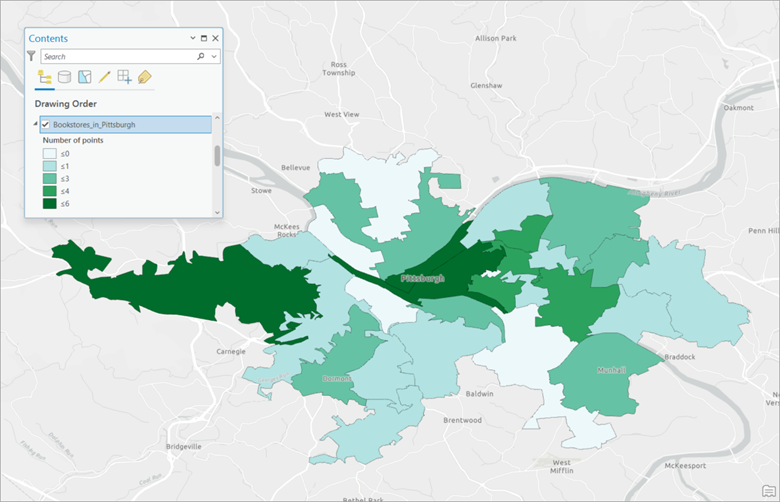
Point data aggregation allows you to summarize an attribute from points of interest at a selected level of geography. For example, you can visualize the count of bookstores in each ZIP code in the search extent, using color-coded polygons to show areas with greater and fewer stores.
Point data contains multiple attributes that you can aggregate. Points of interest datasets vary in the attributes provided. The following sections describe the point data attributes, their calculation options, and availability.
Number of points
The Number of points attribute is the default for all points of interest datasets. The attribute sums the number of points in each area, as determined by the level of detail. For example, if Counties is selected in the Level of detail menu, aggregating by this attribute shows the number of points in each county. For this attribute, the only aggregation calculation type available is count.
Sales volume
The sales volume represents estimated sales revenue or assets in dollars. This attribute is only available when connected to a local U.S. dataset or when Data Axle has been selected as the points of interest data source.
The following calculation types are available for aggregating by this attribute:
Sales Volume (Sum)—The sales volume values for all mapped business locations are added together for each geography.
Sales Volume (Average)—The sum of all sales volume values for all mapped business locations, divided by the number of mapped business locations for each geography.
Sales Volume (Minimum)—The sales volume value for the business location with the lowest sales volume in each geography is mapped.
Sales Volume (Maximum)—The sales volume value for the business location with the highest sales volume in each geography is mapped.
Employee count
The employee count is the estimated number of employees for a business location. This attribute is only available when connected to a local U.S. dataset or when Data Axle has been selected as the points of interest data source.
The following calculation types are available for aggregating by this attribute:
Employee Count (Sum)—The employee count values for all mapped business locations are added together for each geography.
Employee Count (Average)—The sum of all employee count values for all mapped business locations, divided by the number of mapped business locations for each geography.
Employee Count (Minimum)—The employee count value for the business location with the lowest number of employees in each geography is mapped.
Employee Count (Maximum)—The employee count value for the business location with the highest number of employees in each geography is mapped.
Square foot minimum
The square foot minimum is the estimated minimum square footage of the business location, shown as an integer. This attribute is only available when connected to a local U.S. dataset or when Data Axle has been selected as the points of interest data source.
Note that square footage is an attribute that is presented as a range. Mapping the square foot minimum presents the lower value in this range. For example, a business might list 10,000-19,999 square feet as their square footage. In this case, mapping the Square Foot Minimum attribute results in using 10,000 square feet as the mapped value. It does not indicate the actual size of a business location, just what its minimum size may be.
The following calculation types are available for aggregating by this attribute:
Square Foot Minimum (Sum)—The minimum square footage values for all mapped business locations are added together for each geography.
Square Foot Minimum (Average)—The sum of all minimum square footage values for all mapped business locations, divided by the number of mapped business locations for each geography.
Square Foot Minimum (Minimum)—The square footage value for the business location with the lowest minimum square footage in each geography is mapped.
Square Foot Minimum (Maximum)—The square footage value for the business location with the highest minimum square footage in each geography is mapped.
Square foot maximum
The square foot maximum is the estimated maximum square footage of the business location, shown as an integer. This attribute is only available when connected to a local U.S. dataset or when Data Axle has been selected as the points of interest data source.
Note that square footage is an attribute that is presented as a range. Mapping the square foot maximum presents the upper value in this range. For example, a business might list 10,000-19,999 square feet as their square footage. In this case, mapping the Square Foot Maximum attribute results in using 19,999 square feet as the mapped value. It does not indicate the actual size of a business location, just what its maximum size may be.
The following calculation types are available for aggregating this attribute:
Square Foot Maximum (Sum)—The maximum square footage values for all mapped business locations are added together for each geography.
Square Foot Maximum (Average)—The sum of all maximum square footage values for all mapped business locations, divided by the number of mapped business locations for each geography.
Square Foot Maximum (Minimum)—The square footage value for the business location with the lowest maximum square footage in each geography is mapped.
Square Foot Maximum (Maximum)—The square footage value for the business location with the highest maximum square footage in each geography is mapped.
Geoprocessing tool
The points of interest search workflow uses the Generate Points from Business Listings tool. You can use this geoprocessing tool directly to perform the same search and build and run queries through a Python script or a model.