Find Dwell Locations (GeoAnalytics Server Tools)
Summary
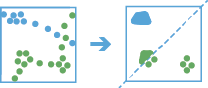
Finds locations where moving objects have stopped, or dwelled, using given time and distance thresholds.
Legacy:
The ArcGIS GeoAnalytics Server extension is being deprecated in ArcGIS Enterprise. The final release of GeoAnalytics Server was included with ArcGIS Enterprise 11.3. This geoprocessing tool is available through ArcGIS Enterprise 11.3 and earlier versions.
Illustration
Usage
This geoprocessing tool is available with ArcGIS Enterprise 10.8 or later.
The input layer must be time-enabled point features that represent an instant in time.
Dwell locations are defined as sequential observations with little or no movement over a certain period of time. Depending on the field of application, this may be referred to as stay points or idle detection.
The following table lists terminology used in the Find Dwell Locations tool:
Term
Description
Dwell location
Features representing when a track has been stationary given specified time and distance parameters. This is the output result from the tool that represents dwell features as either points, convex hulls, or mean centers.
Track
A sequence of features that are time enabled with time type instant. Features are determined to be in the sequence by a track identifier field and are ordered by time. For example, a city could have a fleet of snow plow trucks that record their location every 10 minutes. The vehicle ID could represent the distinct tracks.
Observation
A point in a track.
Geodesic
A line drawn on a sphere. A geodesic line drawn on the globe represents the curvature of the earth's geoid.
Planar
A straight-line distance as measured on a flat surface (that is, a Cartesian plane). This is also referred to as Euclidean distance.
Instant
A single moment in time represented by a start time and no end time.
Interval
A duration of time represented by a start time and an end time.
Results are point features representing instants in time, or area features representing an interval in time. The start and end of the interval are determined by the time of the first and last features in a dwell.
Any features that do not have time will be excluded from the analysis.
Dwell locations can only be detected in tracks with more than one feature.
Dwell locations are determined using both time (Time Tolerance parameter) and distance (Distance Tolerance parameter) values. First, the tool assigns features to a track using a unique identifier. Track order is determined by the time of the features. Then the distance between the first observation in a track and the next is calculated. Features are considered to be part of a dwell if two temporally consecutive points stay within the given distance for at least the given duration. When two features are found to be part of a dwell, the first feature in the dwell is used as a reference point, and the tool finds consecutive features that are within the specified distance of the reference point in the dwell. Once all features within the specified distance are found, the tool collects the dwell features and calculates their mean center. Features before and after the current dwell are added to the dwell if they are within the given distance of the dwell location's mean center. This process continues until the end of the track.
You can specify one or more fields to identify tracks. Tracks are represented by the unique combination of one or more track fields.
By default, dwell locations are created using a geodesic method for distance calculation. It is recommended that you use geodesic distance in the following circumstances:
Tracks cross the international date line—When using the geodesic method, input layers that cross the international date line will have tracks that correctly cross the international date line. This is the default. The input layer or processing spatial reference must be set to a spatial reference that supports wrapping around the international date line, for example, a global projection such as World Cylindrical Equal Area.
The dataset is not in a local projection—If the input data is in a local projection, use the planar distance method. For example, use the planar method to examine dwell locations in a single state. The input layer or processing spatial reference must be set to a spatial reference local to the dataset.
Output dwell locations can be represented in four ways. The following table shows an example of each:
Output Type parameter option
Description
Example
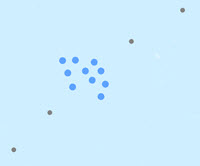
All features
Every feature is returned. The resulting features have time type instant.
Features that belong to a dwell are rendered in blue. Features that do not belong to a dwell are rendered in gray.
Only a count statistic is calculated for this output type. The count represents the number of features that belong to a single dwell. Features that do not belong to a dwell will have a count of 0.
Dwell features
Only features that are part of a dwell are returned. The resulting features have time type instant.
Only a count statistic is calculated for this output type. The count represents the number of features that belong to a single dwell.

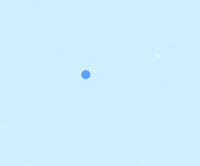
Mean centers
Each dwell has a single point returned representing the mean center of the dwell in distance and time. The resulting features have time type interval.
The count of features in the dwell is always calculated. You can optionally calculate statistics on this type of dwell feature. By default, no statistics are calculated.
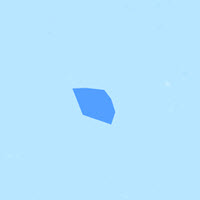
Convex hulls
Each dwell is represented by a convex hull of the dwell features. The resulting features have time type interval.
The count of features in the dwell is always calculated. You can optionally calculate statistics on this type of dwell feature. By default, no statistics are calculated.
In addition to the fields from the input layer and the specified summary statistics, the following fields are included in all output features:
Field name
Description
countThe number of features that are in the dwell
dwellidA unique ID for the dwell to which the feature belongs
meanxThe mean value of the x-coordinates that compose the dwell
meanyThe mean value of the y-coordinates that compose the dwell
meandistanceThe average distance between consecutive points in a dwell location
dwelldurationThe duration of time, in milliseconds, between the first and last observation included in the dwell location
instant_datetimeThe time of the individual feature created when the output type is dwell features, mean centers, or all features
start_datetimeThe start time created when the output type is convex hulls
end_datetimeThe end time created when the output type is convex hulls
If the output type is All features, the results that belong to a dwell will have the fields described above calculated. The results that do not belong to a dwell will return a value of 0 for the
countfield, theinstant_datetimefield will return the time value of the input feature, and all other fields will return a value of null.When calculating the convex hull and a dwell location is completely stationary (one unique location) or composed of two unique points, a small value based on the tolerance of the spatial reference used in an analysis will be used as the width, height, or diameter to create output polygons instead of convex hulls. These polygons are used for visualization and do not represent the spatial extent of the dwell. Examples of these cases are described in the following table:
Input case
Description
Example
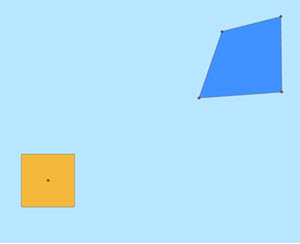
Coincident (one spatially-unique point)
If the input features are stacked (coincident), the resulting convex hull will be an invalid polygon.
In this example, the coincident input features are represented by the red dot in the center of the yellow polygon. The yellow polygon represents the output convex hull result for coincident points. The blue polygon represents what a true convex hull looks like when there are four noncoincident points in a single dwell location.
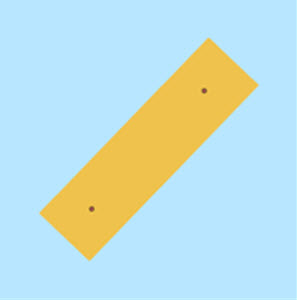
Colinear (two spatially-unique points)
If the input features are in a line (most common with two spatially-unique points), the resulting convex hull will be an invalid polygon.
In this example, colinear points are represented by red dots in the yellow polygon. The yellow polygon represents the output convex hull result for colinear points.
Split tracks using the Time Boundary Split parameter. These segments track at a defined interval. For example, if you set the Time Boundary Reference parameter to 1 day, starting at 9:00 a.m. on January 1, 1990, each track will be truncated at 9:00 a.m. every day. This split accelerates computing time, as it creates smaller tracks for analysis. If splitting by a recurring time boundary makes sense for the analysis, it is recommended for big data processing.
When choosing parameters to calculate dwell locations, consider the type of observation and the scale of dwell that you want to find. The following are examples of how you can modify parameters to find dwells in movement data:
Ship features have
vesselIDandtripIDfields.Use the
vesselIDandtripIDfields as the identifiers to calculate dwell locations along distinct routes.Use a time tolerance of 1 hour and a distance tolerance of 1 nautical mile to discover where vessels stay within 1 nautical mile for at least 1 hour.
Animal trackers have
animalIDfields.Use the
animalIDfield as the identifier to compare dwell locations of specific animals.To determine the range of an animal, use a time tolerance of 3 days, and a distance tolerance of 10 miles to discover animal habitats of interest.
For a smaller area of interest, use a time tolerance of 2 hours, and a distance tolerance of 100 meters.
You can improve the performance of the Find Dwell Locations tool by doing one or more of the following:
Set the extent environment so you only analyze data of interest.
Output results as Dwell features or Mean centers values.
Subdivide tracks as much as possible by adding Track Field inputs.
Use the planar method for distance calculation instead of geodesic.
Split the tracks using the Time Boundary Split parameter.
Use data that is local to where the analysis is being run.
This geoprocessing tool is powered by ArcGIS GeoAnalytics Server. Analysis is completed on GeoAnalytics Server, and results are stored in your content in ArcGIS Enterprise.
When running GeoAnalytics Server tools, the analysis is completed on GeoAnalytics Server. For optimal performance, make data available to GeoAnalytics Server through feature layers hosted on your ArcGIS Enterprise portal or through big data file shares. Data that is not local to GeoAnalytics Server will be moved to GeoAnalytics Server before analysis begins. This means that it will take longer to run a tool and, in some cases, moving the data from ArcGIS Pro to GeoAnalytics Server may fail. The threshold for failure depends on your network speeds, as well as the size and complexity of the data. It is recommended that you always share your data or create a big data file share.
Learn more about sharing data to your portal
Learn more about creating a big data file share through Server Manager
Parameters
| Label | Explanation | Data type |
|---|---|---|
|
Input Features |
The point tracks in which dwells will be found. The input must be a time-enabled layer with features that represent instants in time. |
Feature Set |
|
Output Dataset |
The name of the output feature service. |
String |
|
Track Fields |
One or more fields that will be used to identify unique tracks. |
Field |
|
Distance Method |
Specifies how the distances between dwell features will be calculated.
|
String |
|
Distance Tolerance |
The maximum distance between points to be considered a single dwell location. |
Linear Unit |
|
Time Tolerance |
The minimum time duration to be considered a single dwell location. Both time and distance are considered when finding dwells. Use the Distance Tolerance parameter to specify distance. |
Time Unit |
|
Output Type |
Specifies how the dwell features will be output.
|
String |
|
Summary Statistics (Optional) |
The statistics that will be calculated on specified fields. Value table columns:
|
Value Table |
|
Data Store (Optional) |
Specifies the ArcGIS Data Store where the output will be stored. All results stored in a spatiotemporal big data store will be stored in WGS84. Results stored in a relational data store will maintain their coordinate system.
|
String |
|
Time Boundary Split (Optional) |
A time span to split the input data into for analysis. A time boundary allows you to analyze values within a defined time span. For example, if you use a time boundary of 1 day, and set the time boundary reference to January 1, 1980, tracks will be split at the beginning of every day. |
Time Unit |
|
Time Boundary Reference (Optional) |
The reference time used to split the input data into for analysis. Time boundaries will be created for the entire span of the data, and the reference time does not need to occur at the start. If no reference time is specified, January 1, 1970, is used. |
Date |
Derived output
| Label | Explanation | Data type |
|---|---|---|
|
Output Feature Class |
The output point or polygon dwell locations. |
Record Set |
Environments
Output Coordinate System, Extent, Current Workspace
Special cases
- Output Coordinate System
-
The coordinate system that will be used for analysis. Analysis will be completed in the input coordinate system unless specified by this parameter. For GeoAnalytics Tools, final results will be stored in the spatiotemporal data store in WGS84.
Licensing information
- Basic: Requires ArcGIS GeoAnalytics Server
Available with ArcGIS Enterprise10.8 - Standard: Requires ArcGIS GeoAnalytics Server
Available with ArcGIS Enterprise10.8 - Advanced: Requires ArcGIS GeoAnalytics Server
Available with ArcGIS Enterprise10.8