Summarize Within (GeoAnalytics Server Tools)
Summary
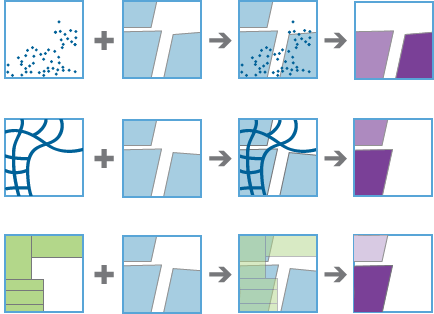
Overlays a polygon layer with another layer to summarize the number of points, length of the lines, or area of the polygons within each polygon and calculates attribute field statistics for those features within the polygons.
Legacy:
The ArcGIS GeoAnalytics Server extension is being deprecated in ArcGIS Enterprise. The final release of GeoAnalytics Server was included with ArcGIS Enterprise 11.3. This geoprocessing tool is available through ArcGIS Enterprise 11.3 and earlier versions.
The following are example scenarios using Summarize Within:
Given watershed boundaries and land-use boundaries by land-use type, calculate total acreage of land-use type for each watershed.
Given county parcels and city boundaries, summarize the average value of vacant parcels within each city boundary.
Given counties and roads, summarize the total mileage of roads by road type within each county.
Illustration
Usage
In basic terms, the Summarize Within tool takes two layers, the input polygons and the input summary features, and stacks them on top of each other. You can view down through the stack and count the number of input summary features that fall within the input polygons. You can also calculate simple statistics about the attributes of the input summary features, such as sum, mean, minimum, maximum, and so on.
Use Summarize Within to calculate standard statistics as well as geographically weighted statistics. Standard statistics summarize the statistical values without weighting. Weighted statistics calculate values using the geographically weighted attributes of lines within a polygon, or the attributes of polygons within a polygon. Weighted statistics do not apply to points within polygons.
Standard statistics and geographically weighted statistics can be calculated for attributes that represent either counts or rates. These are defined as follows:
Counts—Attributes that represent a sum or quantity of an entity at a point location, along a line, or within a polygon. Examples of count-type attributes include the population of a country, the number of taxi pickups in a census block, and the number of dams along a river. For line and polygon features, counts are proportioned before calculating standard or weighted statistics.
Rates—Attributes that represent a ratio or index at a point location, along a line, or within a polygon. Examples of rate-type attributes include the population density of a country, the speed limit of a road, or the walkability score of a neighborhood. Rates are never proportioned.
For count-type attributes, values are proportioned according to the amount of the line within a polygon or the amount of the polygon within another polygon prior to calculating statistics. Statistics are calculated the same way for count-type and rate-type attributes when the summary features are points.
You can calculate the lengths and areas of the summarized layers within each polygon using the options in the table below. Options are based on the geometry of the summarized layer.
Input feature
Description
Option
Points
The count of summarized points within each polygon
None
Lines
The length of summarized lines within each polygon
Statute Miles
International Yards
International Feet
US Survey Miles
US Survey Yards
US Survey Feet
Kilometers
Meters
Areas
The area of summarized polygons within each polygon
Square Statute Miles
Square International Yards
Square International Feet
Square Kilometers
Square Meters
Hectares
International Acres
Square US Survey Miles
Square US Survey Yards
Square US Survey Feet
US Survey Acres
For lines and areas, all weighted statistics will be calculated. Both the standard summary field statistics and the weighted summary field statistics will be applied to data for the features in the Summarized Layer parameter value that intersect the Summary Polygons layer. The weighted summary field statistics will be multiplied by a weight based on the proportion of the features in the Summary Polygons parameter value that intersect each feature in the Summarized Layer parameter value.
For standard statistics, there are eight options: count, sum, mean, minimum, maximum, range, standard deviation, and variance. There are two options for string statistics: count and any. There are three weighted statistics that are calculated on numeric fields in the layer to be summarized: mean, standard deviation, and variance.
Weighted statistics are not calculated for string data. Each time Field and Statistic values are specified, a row is added to the tool pane so more than one statistic can be calculated. You can view the summarized results in the result layer's table or pop-ups. By default, the count of features intersecting the Summary Polygons values is always calculated.
With ArcGIS Enterprise10.6.1 and later, you can calculate a group using the Group By Field parameter. This will create a tabular output in addition to a summarized polygon layer.
The Add Minority and Majority Attributes and Add Group Percentages parameters are available when a Group By Field value is provided. The minority and majority will be the least and most dominant value from the Group By Field parameter, respectively, in which dominance is determined using the count of points, total length, or total area of each value.
When the Add Minority and Majority Attributes parameter is checked, two fields will be added to the result layer. The fields will list the values from the Group By Field parameter that are the minority and majority for each result feature.
The Add Group Percentages parameter is only available when Add Minority and Majority Attributes is checked. When the Add Group Percentages parameter is checked, two fields will be added to the result layer listing the percentage of the count of points, total length, or total area that belong to the minority and majority values for each feature. A percentage field will also be added to the result table listing the percentage of the count of points, total length, or total area that belong to all values from the Group By Field parameter for each feature.
The output feature layer is always a polygon layer. Only polygons that intersect a summarized layer will be returned. Other polygons will be completely removed from the result layer.
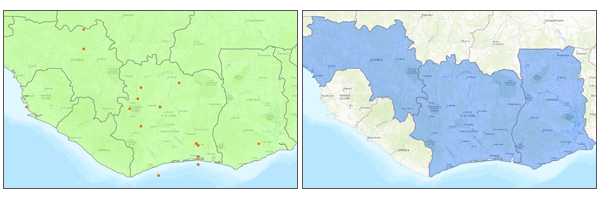
The input point and polygon features (the first image) and the resulting area features (the second image) are shown. The following fields are included in the output polygon features:
Field name
Description
countThe count of summarized features that intersect each polygon layer.
sum_length_<linearunit>, orsum_area_<areaunit>The total length of lines within the polygon or total area of summarized polygon within each polygon. These values are returned when Add shape summary attributes is checked and are returned in the specified unit.
statistic_<fieldname>Specified statistics will each create an attribute field named in the following format: <statistic>_<fieldname>. For example, the maximum and standard deviation of the
idfield isMAX_idandSD_id.pstatistic_<fieldname>Specified weighted statistics will each create an attribute field named in the following format: p<statistic>_<fieldname>. For example, the weighted maximum of the
idfield ispMAX_id.minority_<fieldname>This value is returned when you create a group-by table and Add Minority and Majority Attributes is checked. This represents the values for the specified field that is the minority in each polygon. For example, there are five points in a polygon with a field called
colorand values of red, blue, blue, green, green. If you create a group by thecolorfield, the value for theminority_colorfield is red.majority_<fieldname>This value is returned when you create a group-by table and Add Minority and Majority Attributes is checked. This represents the values for the specified field that is the majority in each polygon. For example, there are five points in a polygon with a field called
colorand values of red, blue, blue, green, green. If you create a group by thecolorfield, the value for themajority_colorfield is blue;green.minority_<fieldname>_percentThis value is returned when you create a group-by table and Add Group Percentages is checked. This represents the percentages of the count for the specified field that is the minority in each polygon. For example, there are five points in a polygon with a field called
colorand values of red, blue, blue, green, green. If you create a group by thecolorfield, the value for theminority_color_percentfield is 20 (calculated as 1/5).majority_<fieldname>_percentThis value is returned when you create a group-by table and Add Group Percentages is checked. This represents the percentages of the count for the specified field that is the majority in each polygon. For example, there are five points in a polygon with a field called
colorand values of red, blue, blue, green, green. If you create a group by thecolorfield, the value for themajority_color_percentfield is 40 (calculated as 2/5).join_idThis value is returned when you create a group-by table. This is an ID to link features to the group-by table. Every
join_idfield corresponds to one or more rows in the group-by table.The following fields are included in the output group-by table:
Field name
Description
join_idThis is an ID to link features to the polygon layer. Each polygon will have one or more features with the same ID that represent all of the group-by values. For example, there are five points in a polygon with a field called
colorand values of red, blue, blue, green, green. The group-by table will have three rows representing that polygon (same join ID), one for each color: red, blue, and green.countThe count of the specified group within the joined polygon. For example, red is 1 for the selected polygon.
<statistic>_<fieldname>Any specified statistic calculated for each group.
p<statistic>_<fieldname>Any specified weighted statistic calculated for each group.
percentcountThe percentage each group contributes to the total count in the polygon. Using the example above, red contributes 1/5 = 20, blue contributes 2/5 = 40, and green contributes 2/5 = 20.
You can improve the performance of the Summarize Within tool by doing one or more of the following:
Set the extent environment so only data of interest will be analyzed.
Larger bins will perform better than smaller bins. If you are using bins and are unsure which size to use, start with a larger bin to prototype.
Use data that is local to where the analysis is being run.
This geoprocessing tool is powered by ArcGIS GeoAnalytics Server. Analysis is completed on GeoAnalytics Server, and results are stored in your content in ArcGIS Enterprise.
When running GeoAnalytics Server tools, the analysis is completed on GeoAnalytics Server. For optimal performance, make data available to GeoAnalytics Server through feature layers hosted on your ArcGIS Enterprise portal or through big data file shares. Data that is not local to GeoAnalytics Server will be moved to GeoAnalytics Server before analysis begins. This means that it will take longer to run a tool and, in some cases, moving the data from ArcGIS Pro to GeoAnalytics Server may fail. The threshold for failure depends on your network speeds, as well as the size and complexity of the data. It is recommended that you always share your data or create a big data file share.
Learn more about sharing data to your portal
Learn more about creating a big data file share through Server Manager
Similar analysis can also be completed using the Summarize Within tool in the Standard Feature Analysis toolbox in ArcGIS Pro.
Parameters
| Label | Explanation | Data type |
|---|---|---|
|
Summarized Layer |
The point, line, or polygon features that will be summarized by either polygons or bins. |
Feature Set |
|
Output Name |
The name of the output polygon feature service containing the intersecting geometries and attributes. |
String |
|
Polygon or Bin |
Specifies whether the Summarized Layer value will be summarized by polygons or bins.
|
String |
|
Bin Type |
Specifies the bin shape that will be generated to summarize features.
|
String |
|
Bin Size (Optional) |
The distance interval that represents the bin size and units by which the input features will be summarized. |
Linear Unit |
|
Summary Polygons (Optional) |
The polygons that will be used to summarize the features in the input summarized layer. |
Feature Set |
|
Add shape summary attributes |
Specifies whether the length of lines or area of polygons within the summary layer (polygon or bin) will be calculated. The count of points, lines, and polygons intersecting the summary shape will always be included.
|
Boolean |
|
Shape Units (Optional) |
Specifies the unit of measurement that will be used to calculate shape summary attributes. If the input summary features are points, a shape unit is unnecessary, since only the count of points within each input polygon is added. If the input summary features are lines, specify a linear unit. If the input summary features are polygons, specify an areal unit.
|
String |
|
Standard Summary Fields (Optional) |
The statistics that will be calculated on specified fields. Value table columns:
|
Value Table |
|
Weighted Summary Fields (Optional) |
Specifies the weighted statistics that will be calculated on specified fields. Value table columns:
|
Value Table |
|
Data Store (Optional) |
Specifies the ArcGIS Data Store where the output will be stored. All results stored in a spatiotemporal big data store will be stored in WGS84. Results stored in a relational data store will maintain their coordinate system.
|
String |
|
Group By Field (Optional) |
A field from the input summary features that will be used to calculate statistics for each unique attribute value. For example, the input summary features contain point locations of businesses that store hazardous materials, and one of the fields is |
Field |
|
Add Minority and Majority Attributes (Optional) |
Specifies whether minority (least dominant) and majority (most dominant) attribute values for each group field within each boundary will be added. When this parameter is checked, two new fields will be added to the output layer prefixed with Minority_ and Majority_. This parameter only applies when a value is provided for the Group By Field parameter.
|
Boolean |
|
Add Group Percentages (Optional) |
Specifies whether percentage fields will be added. When this parameter is checked, the percentage of each unique group value will be calculated for each input polygon. This parameter only applies when a value is provided for the Group By Field parameter and a value is specified for the Add Minority and Majority Attributes parameter.
|
Boolean |
Derived output
| Label | Explanation | Data type |
|---|---|---|
|
Output Feature Layer |
The summarized number of points, length of the lines, or area of the polygons within each polygon. |
Feature Set |
|
Group By Summary |
When group by summary is provided, the tool will output a table containing the calculated statistics for each unique group. |
Record Set |
Environments
Output Coordinate System, Extent, Current Workspace
Special cases
- Output Coordinate System
-
The coordinate system that will be used for analysis. Analysis will be completed in the input coordinate system unless specified by this parameter. For GeoAnalytics Tools, final results will be stored in the spatiotemporal data store in WGS84.
Licensing information
- Basic: Requires ArcGIS GeoAnalytics Server
- Standard: Requires ArcGIS GeoAnalytics Server
- Advanced: Requires ArcGIS GeoAnalytics Server