Measure Cannibalization (Business Analyst Tools)
Summary
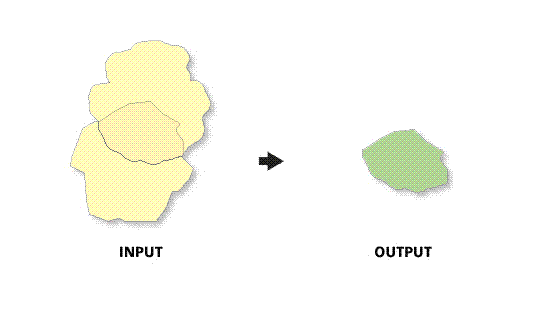
Calculates the amount of overlap between two or more polygons. Overlap refers to the extent of the polygons beyond intersection.
An optional report can be created detailing overlapped statistics.
Illustration
Usage
Metrics describing the overlap areas are included as attributes in the output feature class and in an optional report.
You can select demographic and lifestyle variables from the data browser to return additional fields in the output that define proportions in the affected polygons.
The output attribute table includes a record for each occurrence of overlap between input polygons.
By default, four metrics compare proportions of overlapped area and are returned as individual fields in the output:
A1—Proportion of area: ID 1 to ID 2 (area of polygon ID1 / area of polygon ID2)A2—Proportion of area in overlap (area of polygon ID1 and polygon ID2 intersection / area of polygon ID1 and polygon ID2 union)A3—Proportion of area: ID 1 within ID 2 (area of polygon ID1 and polygon ID2 intersection / area of polygon ID1)A4—Proportion of area: ID 2 within ID 1 (area of polygon ID1 and polygon ID2 intersection / area of polygon ID2)
Variables can be selected from the data browser to be included in the output as additional metrics.
If additional metrics are selected, five additional output fields are returned. The first field contains the value of the variable within the area of overlap. The other four follow the pattern of the standard metrics but use variable values instead of area.
Using current year population as an example, the five additional metrics fields would be as follows:
populationtotals_totpop_cy—Population within area of overlappopulationtotals_totpop_cy_A1—Proportion of population: ID 1 to ID 2populationtotals_totpop_cy_A2—Proportion of population in overlappopulationtotals_totpop_cy_A3—Proportion of population: ID 1 within ID 2populationtotals_totpop_cy_A4—Proportion of population: ID 2 within ID 2
If polygons do not overlap, the output feature class will contain no geometry or records. The output feature class only contains the overlapping geometry from the input.
Polygons must be from a single feature class. Multiple feature classes can be merged into a single feature class using the Merge tool.
The Interpret a Measure Cannibalization report is a PDF document you can use to understand the various sections and elements of the Measure Cannibalization report.
Parameters
| Label | Explanation | Data type |
|---|---|---|
|
Input Features |
The input polygon features that will be analyzed for overlap. |
Feature Layer |
|
Trade Area ID |
The field that uniquely identifies each feature in the input layer. |
Field |
|
Trade Area Description |
The field that describes each feature in the input layer. |
Field |
|
Output Feature Class |
The output feature class that will contain the areas of overlap found in the input layer. |
Feature Class |
|
Store ID Field (Optional) |
The unique ID that associates a store with each polygon when the inputs are trade areas. |
Field |
|
Create Report (Optional) |
Specifies whether a report will be generated.
|
Boolean |
|
Report Title (Optional) |
The title of the report. The default value is |
String |
|
Output Report Folder (Optional) |
The output location where the report will be saved. |
Folder |
|
Report Output Formats (Optional) |
The output format or formats of the report. |
String |
|
Variables (Optional) |
One or more variables that will be used to calculate additional overlap metrics—for example, the total number of people and households in intersection areas, or the percentage of the total number of people and households in a trade area falling into overlapped area. |
String |
Derived output
| Label | Explanation | Data type |
|---|---|---|
|
Output Report |
The output report file or files. |
File |
Environments
Current Workspace, Data Source, Geographic Transformations
Licensing information
- Basic: Requires Business Analyst
- Standard: Requires Business Analyst
- Advanced: Requires Business Analyst