Summarize Attributes (GeoAnalytics Desktop Tools)
Summary
Calculates summary statistics for fields in a feature class.
Usage
Summarize Attributes is a tabular analysis tool, not a spatial analysis tool. Inputs can be a tabular layer or a layer with geometry (points, lines, or polygons).
You can specify one or more fields to summarize by or summarize all features. When you summarize by fields, statistics are calculated for each unique combination of attribute values.
The output table will consist of fields containing the result of the statistical operation.
A field will be created for each specified statistic type using the following naming convention:
sum_<field>,max_<field>,min_<field>,range_<field>,std_<field>,count_<field>,var_<field>, andany_<field>(where<field>is the name of the input field for which the statistic is computed). The statistics will be calculated on each group separately.You can apply this tool to spatial data, and you will get a tabular result. You can join your results to spatial data using Join Features.
If time is enabled on the input, you can apply time stepping to the analysis. Each time step is analyzed independent of features outside the time step. To use time stepping, the input data must be time enabled and represent an instant in time. When time stepping is applied, output features will be time intervals represented by the
START_DATETIMEandEND_DATETIMEfields.The tables below illustrate the statistical calculations of a layer that is summarized using like values of fields. The
VO2field was used to calculate the numeric statistics (Count, Sum, Minimum, Maximum, Range, Mean, Standard Deviation, and Variance) for the layer. TheRatingfield was used to calculate the string statistics (Count and Any) for the layer.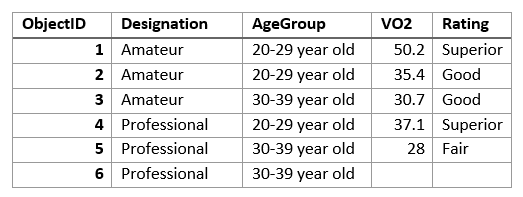
The input layer to be summarized is shown. The table above was summarized on the
Designationfield, and theVO2field was used to calculate the numeric statistics (Count, Sum, Minimum, Maximum, Range, Mean, Standard Deviation, and Variance) for the layer. TheRatingfield was used to calculate the string statistics (Count and Any) for the layer. This results is a table with two features, representing the distinct values ofDesignation.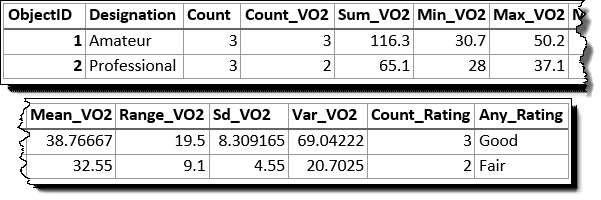
The input layer that has been summarized using the Designation field is shown. The following table represents what the first few fields look like when the layer is summarized using the
DesignationandAge Groupfields. Statistics are calculated using the same methods as the previous example.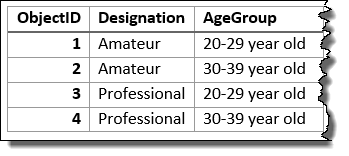
The input layer that has been summarized using the Designation and Age Group fields is shown. You can improve the performance of the Summarize Attributes tool by using the following tips:
Set the extent environment so you only analyze data of interest.
Use data that is local to where the analysis is being run.
This geoprocessing tool is powered by Spark. Analysis is completed on your desktop machine using multiple cores in parallel. See Considerations for GeoAnalytics Desktop tools to learn more about running analysis.
When running GeoAnalytics Desktop tools, the analysis is completed on your desktop machine. For optimal performance, data should be available on your desktop. If you are using a hosted feature layer, it is recommended that you use ArcGIS GeoAnalytics Server. If your data isn't local, it will take longer to run a tool. To use your ArcGIS GeoAnalytics Server to perform analysis, see GeoAnalytics Tools.
Similar analysis can also be completed using the Summary Statistics tool in the Analysis toolbox.
Parameters
| Label | Explanation | Data type |
|---|---|---|
|
Input Layer |
The point, polyline, or polygon layer to be summarized. |
Table View |
|
Output Table |
A new table with the summarized attributes. |
Table |
|
Fields |
A field or fields used to summarize similar features. For example, if you choose a single field called You can optionally select no fields and summarize all features in a single summary result. |
Field |
|
Summary Fields (Optional) |
The statistics that will be calculated on specified fields. Value table columns:
|
Value Table |
|
Time step interval (Optional) |
A value that specifies the duration of the time step. This parameter is only available if the input points are time enabled and represent an instant in time. Time stepping can only be applied if time is enabled on the input. |
Time Unit |
|
Time step repeat (Optional) |
A value that specifies how often the time-step interval occurs. This parameter is only available if the input points are time enabled and represent an instant in time. |
Time Unit |
|
Time step reference (Optional) |
A date that specifies the reference time with which to align the time steps. The default is January 1, 1970, at 12:00 a.m. This parameter is only available if the input points are time enabled and represent an instant in time. |
Date |
Environments
Output Coordinate System, Extent, Current Workspace
Licensing information
- Basic: No
- Standard: No
- Advanced: Yes