This raster analysis portal tool is available when you are signed in to an ArcGIS Enterprise portal that has ArcGIS Image Server configured for Raster Analysis. When the tool is run, ArcGIS Pro serves as a client and the processing occurs in the servers federated with ArcGIS Enterprise. The portal tool accepts layers from your portal as input and creates output in your portal.
The input raster layer supports a layer from the portal, a URI or URL to an image service, or the output from the Make Image Server Layer tool. The input feature layer can be a layer from the portal or a URI or URL to a feature service. This tool does not support local raster data or layers. While you can use local feature data and layers as input to this portal tool, best practice is to use layers from your portal as input.
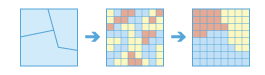
A zone is defined as all areas in the input with the same value. The areas do not have to be contiguous. Both raster and feature can be used for the zone input.
If the Input Zone Layer (inputZoneLayer in Python) is a raster, it must be of integer data type.
If the zone input is a feature, it will be converted to a raster internally using the cell size and cell alignment from the value raster.
When the cell size of the Input Zone Layer (inputZoneLayer in Python) and the Input Raster Layer to Summarize (inputRasterLayertoSummarize in Python) are different, the output cell size will be the Maximum Of Inputs value, and the value raster will be used as the snap raster internally. If the cell size is the same but the cells are not aligned, the value raster will be used as the snap raster internally. Either of these cases will trigger an internal resampling before the zonal operation is performed.
When the zone and value inputs are both rasters of the same cell size and the cells are aligned, they will be used directly in the tool and will not be resampled internally during tool processing.
If a particular zone from the Input Zone Layer does not overlap any cell centers of the input value raster, the zone will become NoData. In this case, determine an appropriate raster resolution that will retain the detail of the zone input and use this resolution as the cell size in the environment. Specifying a smaller cell size will generate a larger output raster. The higher resolution output will not necessarily be as high quality a results, since the additional detail does not exist in the Input Raster Layer to Summarize input.
If the Input Zone Layer has overlapping polygons, the zonal analysis will not be performed for each individual polygon. Since the feature input is converted to a raster, each location can have only one value.
An alternative method is to process the zonal operation iteratively for each polygon zone and collate the results.
If the Input Zone Layer is a point feature, more than one point may be contained within any particular cell of the input value raster. For such cells, the zone value is determined by the point with the lowest ObjectID field (for example, OID or FID).
When specifying the Input Zone Layer, the default zone field will be the first available integer or text field. If no other valid fields exist, the ObjectID field (for example, OID or FID) will be the default.
The supported statistic type depends on the data type of the Input Value Raster, and the statistic calculation type specified by the Calculate Circular Statistics parameter.
If the data type is integer, arithmetic statistics calculation supports Mean, Majority, Majority count, Majority percentage, Maximum, Median, Minimum, Minority, Minority count, Minority percentage, Percentile, Range, Standard deviation, Sum, and Variety options; circular statistics calculation supports Mean, Majority, Minority, Standard deviation, and Variety options.
If the data type is float, arithmetic statistics calculation supports Mean, Maximum, Median, Minimum, Percentile, Range, Standard deviation, and Sum options; circular statistics calculation supports Mean and Standard deviation options.
For majority and minority calculations, when there is a tie, the output will be the lowest of the tied values.
To calculate circular statistics, check the Calculate Circular Statistics parameter (circularCalculation = "CIRCULAR" in Python), and specify a number for Circular Wrap Value (circularWrapValue in Python).
|
Label
|
Explanation
|
Data type
|
|
Input Zone Layer
|
The input that defines the zones.
Both raster and feature data can be used for the zone input.
|
Raster Layer; Feature Layer
|
|
Zone Field
|
The field that defines each zone.
It can be an integer or a string field of the zone dataset.
|
String
|
|
Input Raster Layer to Summarize
|
The raster that contains the values on which to summarize a statistic.
|
Raster Layer
|
|
Output Name
|
The name of the output raster service.
If the image service layer already exists, you will be prompted to provide another name.
|
String
|
|
Statistic Type
(Optional)
|
Specifies the statistic type that will be calculated.
The available options when the raster to summarize is of integer data type are Average, Majority, Majority count, Majority percentage, Maximum, Median, Minimum, Minority, Minority count, Minority percentage, Percentile, Range, Standard deviation, Sum, and Variety.
If the raster to summarize is of float data type, the options are Average, Maximum, Median, Minimum, Percentile, Range, Standard deviation, and Sum.
Average—The average of all cells in the raster layer to be summarized that belong to the same zone as the output cell will be calculated. This is the default.
Majority—The value that occurs most often of all cells in the raster layer to be summarized that belong to the same zone as the output cell will be calculated.
Majority count—The frequency of all cells that contain the majority value in the value raster that belong to the same zone as the output cell will be calculated.
Majority percentage—The percentage of cells that contain the majority value in the value raster that belong to the same zone as the output cell will be calculated.
Maximum—The largest value of all cells in the raster layer to be summarized that belong to the same zone as the output cell will be calculated.
Median—The median value of all cells in the raster layer to be summarized that belong to the same zone as the output cell will be calculated.
Minimum—The smallest value of all cells in the raster layer to be summarized that belong to the same zone as the output cell will be calculated.
Minority—The value that occurs least often of all cells in the raster layer to be summarized that belong to the same zone as the output cell will be calculated.
Minority count—The frequency of all cells that contain the minority value in the value raster that belong to the same zone as the output cell will be calculated.
Minority percentage—The percentage of cells that contain the minority value in the value raster that belong to the same zone as the output cell will be calculated.
Percentile—The percentile of all cells in the value raster that belong to the same zone as the output cell will be calculated. The 90th percentile is calculated by default. You can specify other values (from 0 to 100) using the Percentile Value parameter.
Range—The difference between the largest and smallest value of all cells in the raster layer to be summarized that belong to the same zone as the output cell will be calculated.
Standard deviation—The standard deviation of all cells in the raster layer to be summarized that belong to the same zone as the output cell will be calculated.
Sum—The total value of all cells in the raster layer to be summarized that belong to the same zone as the output cell will be calculated.
Variety—The number of unique values for all cells in the raster layer to be summarized that belong to the same zone as the output cell will be calculated.
|
String
|
|
Ignore Missing Values
(Optional)
|
Specifies whether missing values in the raster layer to summarize will be ignored in the results of the zones that they fall within.
Checked—Within any particular zone, only cells that have a value in the raster layer being summarized will be used in determining the output value for that zone. Missing or NoData cells will be ignored in the statistic calculation. This is the default.
Unchecked—Within any particular zone, if any cells in the raster layer being summarized do not have a value, they will not be ignored and their existence indicates that there is insufficient information to perform statistical calculations for all the cells in that zone. Consequently, the entire zone will receive the NoData value on the output raster.
|
Boolean
|
|
Process as Multidimensional
(Optional)
|
Specifies how the input rasters will be processed if they are multidimensional.
Checked—Statistics will be calculated for all dimensions of the input multidimensional dataset.
Unchecked—Statistics will be calculated from the current slice of the input multidimensional dataset. This is the default.
|
Boolean
|
|
Percentile Value
(Optional)
|
The percentile that will be calculated. The default is 90, indicating the 90th percentile.
The values can range from 0 to 100. The 0th percentile is essentially equivalent to the minimum statistic, and the 100th percentile is equivalent to maximum. A value of 50 will produce essentially the same result as the median statistic.
This parameter is only available while calculating percentile.
|
Double
|
|
Percentile Interpolation Type
(Optional)
|
Specifies the method of interpolation that will be used when the percentile value falls between two cell values from the input value raster.
Auto-detect—If the input value raster is of integer pixel type, the Nearest method will be used. If the input value raster is of floating-point pixel type, the Linear method used. This is the default.
Nearest—The nearest available value to the desired percentile will be used. In this case, the output pixel type is the same as that of the input value raster.
Linear—The weighted average of the two surrounding values from the desired percentile will be used. In this case, the output pixel type is floating point.
|
String
|
|
Calculate Circular Statistics
(Optional)
|
Specifies how the statistics type will be calculated.
Checked—Circular statistics that are appropriate for cyclic quantities will be calculated, such as compass direction in degrees, daytimes, and fractional parts of real numbers.
Unchecked—Arithmetic statistics will be calculated. This is the default.
|
Boolean
|
|
Circular Wrap Value
(Optional)
|
The highest possible value (upper bound) in the cyclic data. It is a positive number, with a default value of 360. This value also represents the same quantity as the lowest possible value (lower bound).
This parameter is only applicable when circular statistics are calculated.
|
Double
|
Derived output
|
Label
|
Explanation
|
Data type
|
|
Output Raster
|
The output raster.
|
Raster Layer
|
arcpy.ra.SummarizeRasterWithin(inputZoneLayer, zoneField, inputRasterLayertoSummarize, outputName, {statisticType}, {ignoreMissingValues}, {processAsMultidimensional}, {percentileValue}, {percentileInterpolationType}, {circularCalculation}, {circularWrapValue})
|
Name
|
Explanation
|
Data type
|
|
inputZoneLayer
|
The input that defines the zones.
Both raster and feature data can be used for the zone input.
|
Raster Layer; Feature Layer
|
|
zoneField
|
The field that defines each zone.
It can be an integer or a string field of the zone dataset.
|
String
|
|
inputRasterLayertoSummarize
|
The raster that contains the values on which to summarize a statistic.
|
Raster Layer
|
|
outputName
|
The name of the output raster service.
If the image service layer already exists, you will be prompted to provide another name.
|
String
|
|
statisticType
(Optional)
|
Specifies the statistic type that will be calculated.
The available options when the value raster is integer are MEAN, MAJORITY, MAJORITY_COUNT, MAJORITY_PERCENT, MAXIMUM, MEDIAN, MINIMUM, MINORITY, MINORITY_COUNT, MINORITY_PERCENT, PERCENTILE, RANGE, STD, SUM, VARIETY.
If the value raster is float, the options are MEAN, MAXIMUM, MEDIAN, MINIMUM, PERCENTILE, RANGE, STD, and SUM.
MEAN—The average of all cells in the raster layer to be summarized that belong to the same zone as the output cell will be calculated. This is the default.
MAJORITY—The value that occurs most often of all cells in the raster layer to be summarized that belong to the same zone as the output cell will be calculated.
MAJORITY_COUNT—The frequency of all cells that contain the majority value in the value raster that belong to the same zone as the output cell will be calculated.
MAJORITY_PERCENT—The percentage of cells that contain the majority value in the value raster that belong to the same zone as the output cell will be calculated.
MAXIMUM—The largest value of all cells in the raster layer to be summarized that belong to the same zone as the output cell will be calculated.
MEDIAN—The median value of all cells in the raster layer to be summarized that belong to the same zone as the output cell will be calculated.
MINIMUM—The smallest value of all cells in the raster layer to be summarized that belong to the same zone as the output cell will be calculated.
MINORITY—The value that occurs least often of all cells in the raster layer to be summarized that belong to the same zone as the output cell will be calculated.
MINORITY_COUNT—The frequency of all cells that contain the minority value in the value raster that belong to the same zone as the output cell will be calculated.
MINORITY_PERCENT—The percentage of cells that contain the minority value in the value raster that belong to the same zone as the output cell will be calculated.
PERCENTILE—The percentile of all cells in the value raster that belong to the same zone as the output cell will be calculated. The 90th percentile is calculated by default. You can specify other values (from 0 to 100) using the percentileValue parameter.
RANGE—The difference between the largest and smallest value of all cells in the raster layer to be summarized that belong to the same zone as the output cell will be calculated.
STD—The standard deviation of all cells in the raster layer to be summarized that belong to the same zone as the output cell will be calculated.
SUM—The total value of all cells in the raster layer to be summarized that belong to the same zone as the output cell will be calculated.
VARIETY—The number of unique values for all cells in the raster layer to be summarized that belong to the same zone as the output cell will be calculated.
|
String
|
|
ignoreMissingValues
(Optional)
|
Specifies whether missing values in the raster layer to summarize will be ignored in the results of the zones that they fall within.
DATA—Within any particular zone, only cells that have a value in the raster layer being summarized will be used in determining the output value for that zone. Missing or NoData cells will be ignored in the statistic calculation. This is the default.
NODATA—Within any particular zone, if any cells in the raster layer being summarized do not have a value, they will not be ignored and their existence indicates that there is insufficient information to perform statistical calculations for all the cells in that zone. Consequently, the entire zone will receive the NoData value on the output raster.
|
Boolean
|
|
processAsMultidimensional
(Optional)
|
Specifies how the input rasters will be processed if they are multidimensional.
ALL_SLICES—Statistics will be calculated for all dimensions of the input multidimensional dataset.
CURRENT_SLICE—Statistics will be calculated from the current slice of the input multidimensional dataset. This is the default.
|
Boolean
|
|
percentileValue
(Optional)
|
The percentile that will be calculated. The default is 90, indicating the 90th percentile.
The values can range from 0 to 100. The 0th percentile is essentially equivalent to the minimum statistic, and the 100th percentile is equivalent to maximum. A value of 50 will produce essentially the same result as the median statistic.
This parameter is only available while calculating percentile.
|
Double
|
|
percentileInterpolationType
(Optional)
|
Specifies the method of interpolation that will be used when the percentile value falls between two cell values from the input value raster.
AUTO_DETECT—If the input value raster is of integer pixel type, the NEAREST method will be used. If the input value raster is of floating-point pixel type, the LINEAR method will be used. This is the default.
NEAREST—The nearest available value to the desired percentile will be used. In this case, the output pixel type is the same as that of the input value raster.
LINEAR—The weighted average of the two surrounding values from the desired percentile will be used. In this case, the output pixel type is floating point.
|
String
|
|
circularCalculation
(Optional)
|
Specifies how the statistics type will be calculated.
CIRCULAR—Circular statistics that are appropriate for cyclic quantities will be calculated, such as compass direction in degrees, daytimes, and fractional parts of real numbers.
ARITHMETIC—Arithmetic statistics will be calculated. This is the default.
|
Boolean
|
|
circularWrapValue
(Optional)
|
The highest possible value (upper bound) in the cyclic data. It is a positive number, with a default value of 360. This value also represents the same quantity as the lowest possible value (lower bound).
This parameter is only applicable when circular statistics are calculated.
|
Double
|
Derived output
|
Name
|
Explanation
|
Data type
|
|
outputRaster
|
The output raster.
|
Raster Layer
|
Code sample
SummarizeRasterWithin example 1 (Python window)
This example determines for each zone the average of cell values in the raster layer to be summarized.
import arcpy
arcpy.ra.SummarizeRasterWithin('https://MyPortal.esri.com/server/rest/services/Hosted/landuse/ImageServer',
                               'Landuse', 'https://MyPortal.esri.com/server/rest/services/Hosted/elevation/ImageServer',
                               'outRaster', 'MEAN', 'DATA')
SummarizeRasterWithin example 2 (stand-alone script)
This example determines for each zone the mean value in the raster layer to be summarized.
#-------------------------------------------------------------------------------
# Name: SummarizeRasterWithin_Ex_02.py
# Description: Calculates the maximum sea-surface temperature at different ecological zones.
# Requirements: ArcGIS Image Server

# Import system modules
import arcpy

# Set local variables
inputZoneLayer = 'https://MyPortal.esri.com/server/rest/services/Hosted/zones/ImageServer'
zoneField = 'temperature'
inputRasterLayertoSummarize = 'https://MyPortal.esri.com/server/rest/services/Hosted/seaSurfaceTemperature/ImageServer'
outputName = 'outSSTRaster'
statisticType = 'MAXIMUM'
ignoreMissingValues = ''
processAsMultidimensional = 'ALL_SLICES'

# Run Multidimensional Summarize Raster Within operation
arcpy.ra.SummarizeRasterWithin(inputZoneLayer, zoneField, inputRasterLayertoSummarize,
                               outputName, statisticType, ignoreMissingValues)