Zonal Statistics As Table (Raster Analysis Tools)
Summary
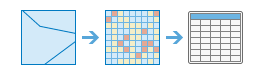
Calculates the values of a raster within the zones of another dataset and reports the results to a table.
Illustration
Usage
This raster analysis portal tool is available when you are signed in to an ArcGIS Enterprise portal that has ArcGIS Image Server configured for Raster Analysis. When the tool is run, ArcGIS Pro serves as a client and the processing occurs in the servers federated with ArcGIS Enterprise. The portal tool accepts layers from your portal as input and creates output in your portal.
The input raster layer supports a layer from the portal, a URI or URL to an image service, or the output from the Make Image Server Layer tool. The input feature layer can be a layer from the portal or a URI or URL to a feature service. This tool does not support local raster data or layers. While you can use local feature data and layers as input to this portal tool, best practice is to use layers from your portal as input.
A zone is defined as all areas in the input with the same value. The areas do not have to be contiguous. Both raster and feature can be used for the zone input.
If the Input Zone Raster or Features (
inputZoneRasterOrFeaturesin Python) is a raster, it must be an integer raster.If the zone is a feature, it will be converted to a raster internally using the cell size and cell alignment from the Input Value Raster (
inputValueRasterin Python).If the cell size or cell alignment of the Input Zone Raster or Features and Input Value Raster parameter values is different, the Input Value Raster value will be used as the cell size and the snap raster internally. Either of these cases will trigger an internal resampling before the zonal operation is performed.
When the zone and value inputs are both rasters of the same cell size and the cells are aligned, they will be used directly in the tool and will not be resampled internally during tool processing.
If the Input Zone Raster or Features is a feature, for any of the zone features that do not overlap any cell centers of the value raster, those zones will not be converted to the internal zone raster. As a result, those zones will not be represented in the output. You can manage this by determining an appropriate value for the Cell Size environment that will preserve the necessary level of detail of the feature zones, and specify it in the analysis environment. Specifying a smaller cell size will generate a larger output raster. The higher resolution output will not necessarily be as high quality a result, since the additional detail does not exist in the Input Value Raster.
If the Input Zone Raster or Features has overlapping features, the zonal analysis will be performed for each individual feature.
If the Input Zone Raster or Features is a point feature, more than one point may be contained within any particular cell of the value input raster. For such cells, the zone value is determined by the point with the lowest ObjectID field (for example,
OIDorFID).When specifying the Input Zone Raster or Features, the default zone field will be the first available integer or text field. If no other valid fields exist, the ObjectID field (for example,
OIDorFID) will be the default.The supported statistic type depends on the data type of the Input Value Raster, and the statistic calculation type specified by the Calculate Circular Statistics parameter.
If the data type is integer, arithmetic statistics calculation supports Mean, Majority, Majority count, Majority percentage, Maximum, Median, Minimum, Minority, Minority count, Minority percentage, Percentile, Range, Standard deviation, Sum, and Variety options; circular statistics calculation supports Mean, Majority, Minority, Standard deviation, and Variety options.
If the data type is float, arithmetic statistics calculation supports Mean, Maximum, Median, Minimum, Percentile, Range, Standard deviation, and Sum options; circular statistics calculation supports Mean and Standard deviation options.
For majority and minority calculations, when there is a tie, the output will be the lowest of the tied values.
To calculate circular statistics, check the Calculate Circular Statistics parameter (
circularCalculation = "CIRCULAR"in Python), and specify a number for Circular Wrap Value (circularWrapValuein Python).A field or series of fields will be created in the output table depending on the Statistic Type parameter value (
statisticTypein Python).The name of the field is the same as the Statistics type value for arithmetic statistics calculation. This is the default.
However, for circular statistics, the name of the field will be prefaced with
C_, followed by the specified statistic. For example, the field name will beMedianfor the arithmetic median statistic andC_Medianfor the circular median statistic.
Parameters
| Label | Explanation | Data type |
|---|---|---|
|
Input Zone Raster or Features |
The input that defines the zones. Both raster and feature data can be used for the zone input. |
Raster Layer; Feature Layer |
|
Input Value Raster |
The raster that contains the values on which to summarize a statistic. |
Raster Layer |
|
Output Table Name |
The name of the output table. If it's an existing table, you will be prompted to provide another name. |
String |
|
Zone Field |
The field that defines each zone. It can be an integer or a string field of the zone dataset. |
String |
|
Ignore NoData in Calculations (Optional) |
Specifies whether NoData values in the value input will be ignored in the results of the zone that they fall within.
|
Boolean |
|
Statistic Type (Optional) |
Specifies the statistic type that will be calculated. The available options when the value raster is integer are All, Mean, Majority, Majority count, Majority percentage, Majority value, count, and percentage, Maximum, Median, Minimum, Minority, Minority count, Minority percentage, Minority value, count, and percentage, Percentile, Range, Standard deviation, Sum, Variety, Minimum and Maximum, Mean and Standard deviation, and Minimum, Maximum and Mean. If the value raster is float, the options are All, Mean, Maximum, Median, Percentile, Minimum, Range, Standard deviation, and Sum.
|
String |
|
Percentile Values (Optional) |
The percentile that will be calculated. The default is 90, indicating the 90th percentile. The values can range from 0 to 100. The 0th percentile is essentially equivalent to the minimum statistic, and the 100th percentile is equivalent to maximum. A value of 50 will produce essentially the same result as the median statistic. This parameter is only available while calculating percentile. |
Double |
|
Process as Multidimensional (Optional) |
Specifies how the input rasters will be processed if they are multidimensional.
|
Boolean |
|
Percentile Interpolation Type (Optional) |
Specifies the method of interpolation that will be used when the percentile value falls between two cell values from the input value raster.
|
String |
|
Calculate Circular Statistics (Optional) |
Specifies how the statistics type will be calculated.
|
Boolean |
|
Circular Wrap Value (Optional) |
The highest possible value (upper bound) in the cyclic data. It is a positive number, with a default value of 360. This value also represents the same quantity as the lowest possible value (lower bound). This parameter is only applicable when circular statistics are calculated. |
Double |
Derived output
| Label | Explanation | Data type |
|---|---|---|
|
Output Table |
The output table. |
Table View |
Environments
Cell Size, Extent, Mask, Output Coordinate System, Snap Raster
Licensing information
- Basic: Requires ArcGIS Image Server
- Standard: Requires ArcGIS Image Server
- Advanced: Requires ArcGIS Image Server