This tool does not scale categorical data. To include categorical data into a fuzzy overlay analysis, a preprocessing step is necessary. You can create a model or run the following geoprocessing tools. First, use the Reclassify tool to provide a new range of values (for example, 1 to 100). Then use the Divide tool to divide the result by a factor (for example, by 100) to normalize the output values to be between 0.0 and 1.0.
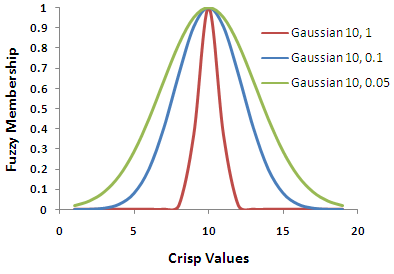
The spread determines how rapidly the fuzzy membership values decrease from 1 to 0. The larger the value, the steeper the fuzzification around the midpoint. That is, as the spread gets smaller, the fuzzy memberships approach 0 more slowly. The selection of the appropriate spread value is a subjective process that is dependent on the range of the crisp values. For Gaussian and Near membership types, the default value of 0.1 is a good starting point. Typically, the values vary within the ranges of [0.01–1] or [0.001-1], respectively. For Small and Large membership types, the default value of 5 is a good starting point in which, typically, the values vary between 1 and 10.
There are cases in which none of the input values have a 100 percent possibility of being a member of the specified set. In other words, no input value has a fuzzy membership of 1. In this case, you can rescale the fuzzy membership values to reflect the new scale. For example, if the highest membership for the input values is .75, you can establish the new scale by multiplying each of the fuzzy membership values by 0.75.
The Hedge parameter options are Very, Somewhat, and None. Very is also known as concentration and is defined as the fuzzy membership function squared. Somewhat is known as dilation, or More or Less, and is the square root of the fuzzification membership function. The Very and Somewhat hedges decrease and increase, respectively, the fuzzy membership functions.
Negative values are not accepted in the Small and Large membership types.
For the Linear membership type, the input raster must be ordered data. The minimum can be less than the maximum to create a positive slope or greater than the maximum to create a negative slope for the transformation.
If the minimum is less than the maximum, a positive-sloped function is used for the transformation; if the minimum is less than the maximum, a negative-sloped function is used.
The input raster whose values will be scaled from 0 to 1.
It can be an integer or a floating-point raster.
Raster Layer
Membership type
(Optional)
Specifies the algorithm used in fuzzification of the input raster.
Certain settings for this parameter use the Spread type to determine how rapidly the fuzzy membership values decrease from 1 to 0. The default values for the spread are detailed in the entries below.
Gaussian—Assigns a membership value of 1 at the midpoint.
The membership decreases to 0 for values that deviate from the midpoint according to a normal curve. Gaussian is similar to the Near type but has a more narrow spread.
Midpoint—The default is the midpoint of the range of values of the input raster.
Spread—The default is 0.1. Typically, the values vary between [0.01–1].
Small—Indicates that small values of the input raster have high membership in the fuzzy set.
A membership value of 0.5 is assigned at the midpoint.
Midpoint—The default is the midpoint of the range of values of the input raster.
Spread—The default is 5.
Large—Indicates that large values of the input raster have high membership in the fuzzy set.
A membership value of 0.5 is assigned at the midpoint.
Midpoint—The default is the midpoint of the range of values of the input raster.
Spread—The default is 5.
Near—Calculates memberships for values near an intermediate value.
A membership value of 1 is assigned at the midpoint. The membership decreases to 0 for values that deviate from the midpoint.
Midpoint—The default is the midpoint of the range of values of the input raster.
Spread—The default is 0.1. Typically, the values vary within the range of [0.001–1].
MSLarge—Calculates membership based on the mean and standard deviation of the input data in which large values have high membership.
The result can be similar to the Large type, depending on how the multipliers of the mean and standard deviation are defined.
Mean multiplier—The default is 1.
Standard deviation multiplier—The default is 2.
MSSmall—Calculates membership based on the mean and standard deviation of the input data in which small values have high membership. This is the default membership type.
The result can be similar to the Small type, depending on how the multipliers of the mean and standard deviation are defined.
Mean multiplier—The default is 1.
Standard deviation multiplier—The default is 2.
Linear—Calculates membership based on the linear transformation of the input raster.
A membership value of 0 is assigned at the minimum and a membership value of 1 is assigned at the maximum.
Minimum—The default is 1.
Maximum—The default is 2.
Fuzzy function
Hedge
(Optional)
Specifies the hedge that will be applied. A hedge increases or decreases the fuzzy membership values, which modify the meaning of a fuzzy set. Hedges help in controlling the criteria or important attributes.
None—No hedge will be applied. This is the default.
Somewhat—A hedge known as dilation and defined as the square root of the fuzzy membership function will be applied. This hedge increases the fuzzy membership functions.
Very—A hedge known as concentration and defined as the fuzzy membership function squared will be applied. This hedge decreases the fuzzy membership functions.
String
Return value
Label
Explanation
Data type
Output raster
The output will be a floating-point raster with values ranging from 0 to 1.
The following are the forms of the membership classes:
FuzzyGaussian({midpoint},{spread})
FuzzyLarge({midpoint},{spread})
FuzzyLinear({minimum},{maximum})
FuzzyMSLarge({meanMultiplier},{STDMultiplier})
FuzzyMSSmall({meanMultiplier},{STDMultiplier})
FuzzyNear({midpoint},{spread})
FuzzySmall({midpoint},{spread})
Fuzzy function
hedge
(Optional)
Specifies the hedge that will be applied. A hedge increases or decreases the fuzzy membership values, which modify the meaning of a fuzzy set. Hedges help in controlling the criteria or important attributes.
NONE—No hedge will be applied. This is the default.
SOMEWHAT—A hedge known as dilation and defined as the square root of the fuzzy membership function will be applied. This hedge increases the fuzzy membership functions.
VERY—A hedge known as concentration and defined as the fuzzy membership function squared will be applied. This hedge decreases the fuzzy membership functions.
String
Return value
Name
Explanation
Data type
out_raster
The output will be a floating-point raster with values ranging from 0 to 1.
Raster
Code sample
FuzzyMembership example 1 (Python window)
This example creates a fuzzy membership raster using the Gaussian function in which elevation values closer to the midpoint (1,200 ft.) have a higher membership value.
import arcpy
from arcpy.sa import *
from arcpy import env
env.workspace = "c:/sapyexamples/data"
outFzyMember = FuzzyMembership("elevation", FuzzyGaussian(1200, 0.06))
outFzyMember.save("c:/sapyexamples/fzymemb")
FuzzyMembership example 2 (stand-alone script)
This example creates a fuzzy membership raster using the Gaussian function and a spread of 0.4 in which elevation values closer to the midpoint (1,000 ft.) have a higher membership value.
# Name: FuzzyMembership_Ex_02.py
# Description: Scales input raster data into values ranging from zero to one
#     indicating the strength of a membership in a set.
# Requirements: Spatial Analyst extension

# Import system modules
import arcpy
from arcpy import env
from arcpy.sa import *

# Set environment settings
env.workspace = "C:/sapyexamples/data"

# Set local variables
inRaster = "elevation"

# Create the FuzzyGaussian algorithm object
midpoint = 1000
spread = 0.4
myFuzzyAlgorithm = FuzzyGaussian(midpoint, spread)

# Run FuzzyMembership
outFuzzyMember = FuzzyMembership(inRaster, myFuzzyAlgorithm)

# Save the output
outFuzzyMember.save("c:/sapyexamples/fzymemb2")