カラー コード レイヤー (Business Analyst ツール)

サマリー

ビジネス、人口統計、消費者、地形の特性を記述した変数から、縮尺に応じた複数レベルの階級区分レイヤーを作成します。

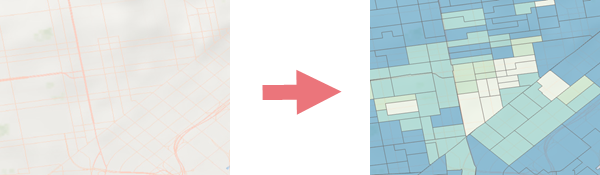
カラー コード レイヤー ツールの図

使用法

  • 出力は、ユーザー定義の変数が指定された、縮尺に応じた行政区画レベルを含むグループ レイヤーです。 デフォルトでは、すべてのレベルと各レベル内のすべてのフィーチャがグループ レイヤーに含まれます。

  • ローカル データまたはオンライン データをカラーコード レイヤーの作成に使用できます。 データはデータ ブラウザーを使用して検索できます。

  • 対象地域 パラメーターは解析の区画範囲を定義します。 次の情報も対象地域に関係しています。

    • 対象地域はローカル データでのみサポートされます。

    • 出力ではフィーチャ データセットが作成されます。

    • 対象地域を指定した場合、対象地域と交差する行政区画レベルのうち、10,000 個を超えるフィーチャを含むものはグループ レイヤーに含まれません。

    • 対象地域を指定した場合、カラー コード グループ レイヤー シンボル ウィンドウおよびリボンのショートカット メニューが有効になり、このツールの外部で追加の設定と便利な機能がサポートされます。

  • 分類方法 パラメーターが 自動 に設定されている場合は、それぞれの変数タイプで次の方法が使用されます。

    方法

    変数のタイプ

    自然分類 (Jenks)

    カウント、密度

    等間隔分類

    中央値、割合、1 人当たり

    標準偏差

    平均、パーセント、インデックス、比率

  • カスタム データ (.sdcx ファイル) 変数にはカスタム フィーチャ レイヤーのみが含まれます。複数のレベルは作成されません。

  • 単一のグリッドのカラー ランプを使用して 2 つの変数をマッピングして両属性を分類するには、二次変数 パラメーターを使用します。

  • 2 つの変数が選択された場合、デフォルトのシンボル オプションは 2 変量色 になります。

パラメーター

ラベル 説明 データ タイプ

一次変数

カラーコード マップとして表示する変数。

String

出力レイヤー名

マップに追加されるカラーコード レイヤーの名前。

String

分類方法

クラス閾値の計算に使用する方法を指定します。

  • Natural Breaks (Jenks)Natural breaks classes are based on natural groupings inherent in the data. Class breaks that best group similar values and maximize the differences between classes will be identified. This is the default.

  • QuantileEach class will contain an equal number of features. A quantile classification is well suited to linearly distributed data.

  • Equal IntervalThe range of attribute values will be divided into equal-sized subranges. This allows you to specify the number of intervals and will automatically determine the class breaks based on the value range.

  • Standard DeviationClass breaks will be placed above and below the mean value at a specified interval size, such as 2, 1, or 0.5, in the unit of standard deviation, until reaching the minimum and maximum values of the input variable.

  • Geometric IntervalClass breaks will be created based on class intervals that have a geometric series. The geometric coefficient in this classifier can change once (to its inverse) to optimize the class ranges.

  • AutoClassification methods will be automatically defined using the variable metadata. This presents the recommended thematic map style based on the data type.

String

クラス数

マップ上に表示されるデータ分類の区切れの数。 デフォルト値は 5 です。

String

対象地域

(オプション)

解析の区画範囲を決定するために使用されるフィーチャ レイヤー。

Feature Layer

出力ジオデータベース

(オプション)

出力フィーチャ データセットが作成されるジオデータベース。

Workspace

フィーチャ データセット名

(オプション)

カラー コード レイヤー フィーチャクラスが作成される、出力ジオデータベース内のフィーチャ データセットの名前。

String

境界モード

(オプション)

カラーコード グループ レイヤーのレベルを作成するために使用される境界のタイプを指定します。

  • Standard GeographiesBoundaries will be levels of standard geographies. This is the default.

  • H3 HexagonsBoundaries will be levels of H3 hexagons.

String

二次変数

(オプション)

カラーコード マップとして表示する二次変数。

String

グリッド サイズ

(オプション)

2 変量色シンボルを作成する際に使用されるグリッド サイズを指定します。

  • 2X2A 4-class bivariate color scheme will be used.

  • 3X3A 9-class bivariate color scheme will be used. This is the default.

  • 4X4A 12-class bivariate color scheme will be used.

String

シンボルのタイプ

(オプション)

使用されるシンボルのタイプを指定します。

  • Bivariate ColorsTwo variables will be displayed using a grid color scheme.

  • Graduated ColorsVarying color shades will be displayed across geographical areas. This is the default.

  • Graduated SymbolsVarying symbol sizes will be displayed across geographical areas.

String

派生した出力

ラベル 説明 データ タイプ

出力レイヤー

出力レイヤーのコンテナー。

Group Layer

更新されたフィーチャ データセット

新しい出力フィーチャ データセット。

Feature Dataset

環境

現在のワークスペース, データ ソース

ライセンス情報

  • Basic: Business Analyst が必要
  • Standard: Business Analyst が必要
  • Advanced: Business Analyst が必要