Color Coded Layer (Business Analyst Tools)
Краткая информация
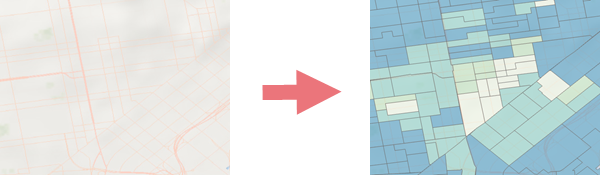
Creates multilevel, scale-dependent choropleth layers from a variable describing a business, demographic, consumer, or landscape characteristic.
Иллюстрация
Использование
The output is a group layer containing scale-dependent administrative geography levels with a user-defined variable. By default, all levels and all features within each level are included in the group layer.
Local data or online data can be used to create a color-coded layer. The data can be explored through the data browser.
The Area of Interest parameter defines the geographic extent of the analysis. The following also pertain to the area of interest:
It is only supported with local data.
The output creates a feature dataset.
If specified, administrative geography levels intersecting the area of interest that include more than 10,000 features will not be included in the group layer.
If specified, it enables the Color Coded Group Layer symbology pane and ribbon contextual menu and supports additional settings and usability features outside of this tool.
When the Classification Method parameter is set to Auto, the following methods will be used for each variable type:
Method
Variable Type
Natural Breaks (Jenks)
Count, Density
Equal Interval
Median, Rate, Per capita
Standard Deviation
Average, Percent, Index, Ratio
Custom data (
.sdcxfile) variables only include the custom feature layer; multiple levels will not be created.Use the Secondary Variable parameter to map two variables with a single grid color ramp to classify both attributes.
When two variables are selected, the default symbology option will be Bivariate Colors.
Параметры
| Подпись | Объяснение | Тип данных |
|---|---|---|
|
Primary Variable |
A variable that will display as a color-coded map. |
String |
|
Output Layer Name |
The name of the color-coded layer that will be added to the map. |
String |
|
Classification Method |
Specifies the method that will be used to calculate the class breaks.
|
String |
|
Number of Classes |
The number of data classification breaks that will appear on the map. The default value is 5. |
String |
|
Area of Interest (Дополнительный) |
The feature layer that will be used to determine the geographic extent of the analysis. |
Feature Layer |
|
Output Geodatabase (Дополнительный) |
The geodatabase in which the output feature dataset will be created. |
Workspace |
|
Feature Dataset Name (Дополнительный) |
The name of the feature dataset in the output geodatabase in which the color-coded layer feature classes will be created. |
String |
|
Boundary Mode (Дополнительный) |
Specifies the types of boundaries that will be used to create levels in the color-coded group layer.
|
String |
|
Secondary Variable (Дополнительный) |
A second variable that will display as a color-coded map. |
String |
|
Grid Size (Дополнительный) |
Specifies the grid size that will be used to create the bivariate color symbology.
|
String |
|
Symbology Type (Дополнительный) |
Specifies the type of symbology that will be used.
|
String |
Производные выходные данные
| Подпись | Объяснение | Тип данных |
|---|---|---|
|
Output Layer |
A container for the output layer. |
Group Layer |
|
Updated Feature Dataset |
The new output feature dataset. |
Feature Dataset |
Параметры среды
Current Workspace, Data Source
Информация о лицензировании
- Basic: Requires Business Analyst
- Standard: Requires Business Analyst
- Advanced: Requires Business Analyst