Make a layout
To share your work as a printed map, poster, or PDF file, you need to make a layout. A layout is a composition of one or more maps, along with supporting elements such as a title, a legend, and descriptive text. Some layouts include more than one map. For example, a layout may have a main map and an overview map to show the main map in a larger geographic context.
Overview
- This video was created with ArcGIS Pro 3.1.
In this tutorial, you will create a layout and add map frames, a legend, a north arrow, a scale bar, and descriptive text. When the layout is finished, you will export it as a PDF file.
Estimated time: 45 minutes
Software requirements: ArcGIS Pro Basic
Note:
The quick-start tutorials are updated at each software release. For the best experience, use an online help version that matches your software version.
Open the project
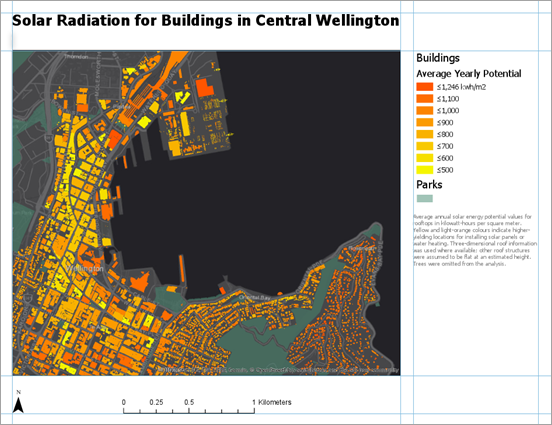
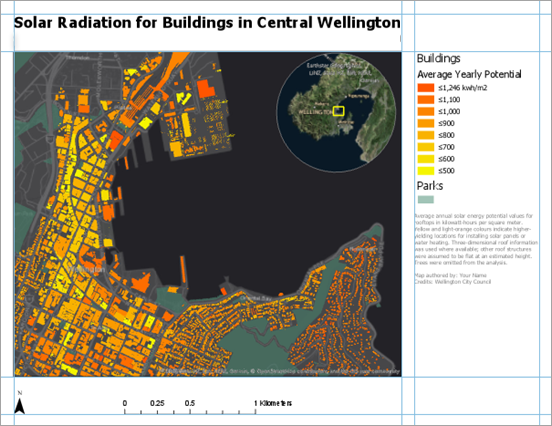
In this project, you'll make a map layout of average yearly solar radiation for buildings in central Wellington, New Zealand. The layout is designed to help businesses and homeowners decide whether to invest in solar energy heating technology.
Start ArcGIS Pro and sign in if necessary.
Open a browse dialog box to search for the project in one of the following ways:
On the start page, click Open another project
 .
.In an open project, click the Project tab on the ribbon. In the list of side tabs, click Open. On the Open page, click Open another project
.
On the Open Project browse dialog box, in the navigation pane, under Portal
 , click ArcGIS Online
  .
.Note:
If you are signed in to ArcGIS Enterprise
, you must set your active portal to ArcGIS Online to access the tutorial data. If you can't do this, you can download the data from a browser.At the top of the dialog box, in the Search box, type Make a layout and press the Enter key.
In the list of search results, click Make a layout to select the project package.
Note:
If there is more than one project package with this name, select the package with the Authoritative badge
 . In the Owner column, the owner name is ArcGISProTutorials. If you don't get any results, see No search results are returned.
Click OK.
The project opens with an active map view showing buildings in central Wellington, New Zealand. The buildings are symbolized by their average yearly solar radiation. Dark-orange buildings get the most sun exposure; yellow buildings get the least.
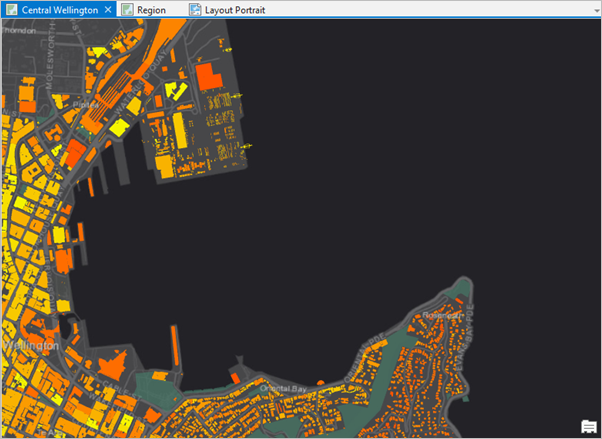
Solar radiation values are expressed in kilowatt-hours of potential electricity per square meter of rooftop. On the ribbon, click the View tab. In the Windows group, click Pane Sets
 and click Mapping
  .
.This ensures that the Contents and Catalog panes are open and that other panes are closed.
Make the Region map view active by clicking its tab, located directly above the view.
The Region map contains an imagery basemap of Wellington and the surrounding area. You'll use it later in the tutorial to add an overview map to your layout.
Make the Layout Portrait view active by clicking its tab.
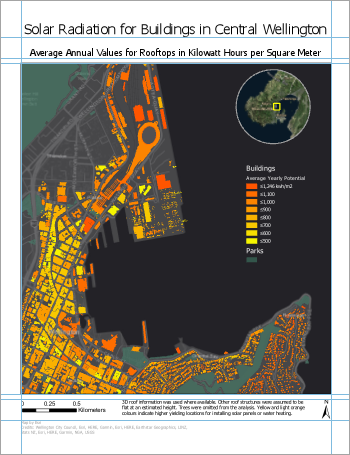
A layout based on the Central Wellington map opens. The layout includes the main map, a circular overview map, a title, and other elements. An ArcGIS Pro project can contain multiple maps and multiple layouts. You'll make a second layout similar to this one but with a landscape orientation.
Create a layout
You'll create a blank layout with the dimensions of a standard sheet of paper with a landscape orientation.
On the ribbon, click the Insert tab if necessary. In the Project group, click New Layout
 to show page size and orientation options.
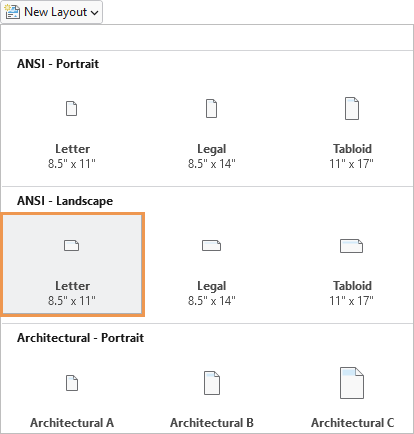
Under ANSI - Landscape, click Letter.
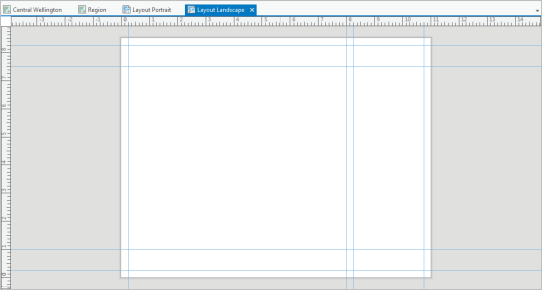
A new, blank layout view opens in the project.
In the Contents pane, under Drawing Order, right-click Layout and click Properties.
On the Layout Properties dialog box, click the General tab. Change the name from Layout to Layout Landscape and click OK.
The name change is reflected in the Contents pane and on the view tab above the ruler.
Right-click the top ruler and click Add Multiple Guides
 .
.Guides are nonprinting lines that help you align elements on the layout.
On the Add Guides dialog box, under Orientation, click Both.
Click the Placement drop-down arrow and click Offset from edge.
Replace the value in the Margin box with 0.25 in. Click OK.
Guides are added to the layout at one-quarter inch from each margin.
Right-click the top ruler and click Add Multiple Guides
again.On the Add Guides dialog box, under Orientation, click Horizontal. Click the Placement drop-down arrow and click Offset from edge. Under Margin, change the value to 1 in. Click OK.
Right-click the top ruler again and click Add Guide (not Add Multiple Guides).
A single vertical guide is added at the position you clicked.
On the ruler, place the mouse pointer at the location of the guide you just added.
A blue inverted triangle appears on the ruler.
Drag the triangle to move the guide to the 8.00 inch mark.
As the guide moves, a ScreenTip displays the decimal equivalent of the ruler marks.
Right-click the top ruler again and click Add Guide. Move this guide to the 8.25 inch mark.
Tip:
To delete a guide, hover over the ruler at the location of the guide. Right-click the blue triangle that appears and click Remove Guide.
On the Quick Access Toolbar, click Save Project
 .
.
Add a map frame
Now you'll add the Central Wellington map to the layout.
On the ribbon, on the Insert tab, in the Map Frames group, click the Map Frame drop-down arrow. Under Central Wellington, click either thumbnail image of the Central Wellington map.
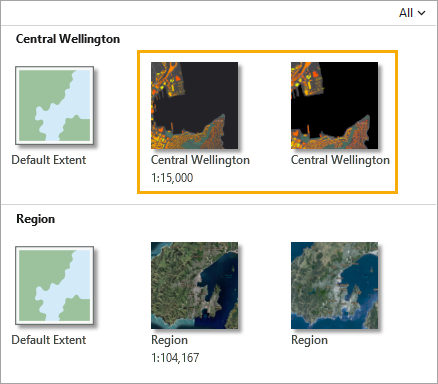
The first thumbnail represents the map at its current scale in the Central Wellington map view. The second thumbnail represents the map at its scale in a saved bookmark. (You can hover over the thumbnails to see the two sources.) The scales are similar—and you will change the scale, anyway—so it doesn't matter which thumbnail you choose.
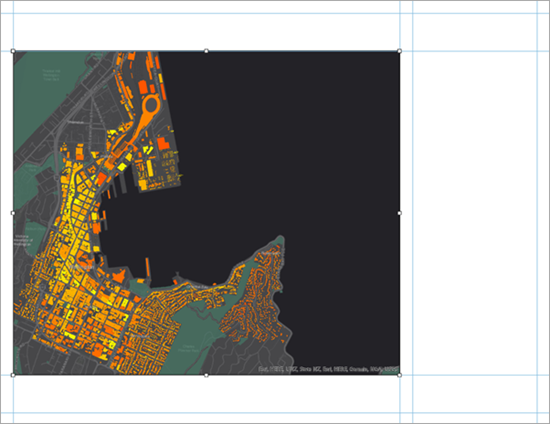
Use your mouse to draw a large rectangle on the layout.
The map frame is added to the layout. It is currently selected, as indicated by selection handles. On the ribbon, the Map Frame tab appears.
Tip:
You can add map frames and other elements to the layout either with a single click or by drawing a rectangle.
On the layout, drag the map frame to align its left edge with the vertical guide at 0.25 inches.
Tip:
Click Snapping
 at the bottom of the layout view to turn snapping on and off. When snapping is on (the default), you can snap to guides as well as to other elements on the layout.
Use the selection handles to resize the map frame. Align its top and bottom edges to the horizontal guides at 7.5 and 1 inches. Drag its right edge to the vertical guide at 8 inches.
Resizing the map frame changes the scale and extent of the map, so you may want to make adjustments. To work with the map as a map—rather than as a layout element—you activate the map frame.
On the ribbon, click the Layout tab. In the Map group, click Activate
 .
.The layout page turns gray. On the ribbon, the Map tab and its tools replace the Layout tab.
On the Map tab, in the Navigate group, confirm that the Explore tool
 is selected. Pan and zoom the map to an extent that you like.
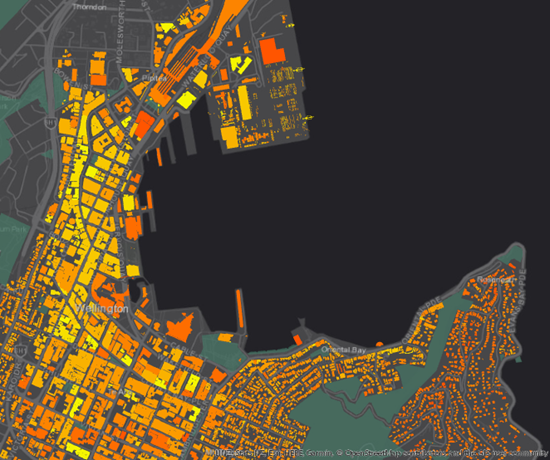
A scale close to 1:15,000 is a good choice for this map.
Tip:
Use the map scale box in the lower left corner of the layout view to set an exact map scale. You can choose a scale from the drop-down list or type a value directly in the scale box.
On the ribbon, click the Layout tab. In the Map group, click Close Activation
 .
.Tip:
You can also close the activated map frame from the layout view by clicking either Close activated map frame button:
 or
or  .
.
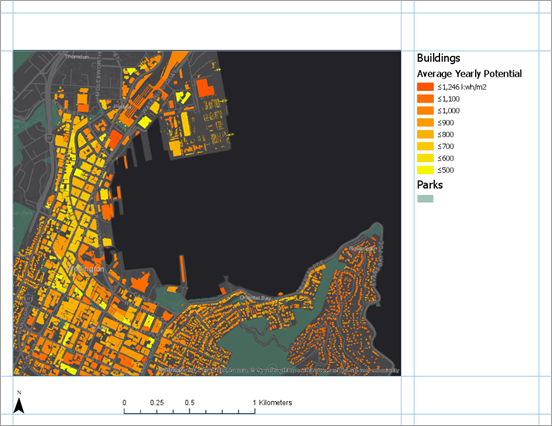
Add map surrounds
You'll add a legend, north arrow, and scale bar to the layout. The legend explains the map's symbology. The north arrow and scale bar provide geographic context.
On the ribbon, click the Insert tab if necessary. In the Map Surrounds group, click the Legend
 drop-down arrow and click Title and Text Aligned Legend.
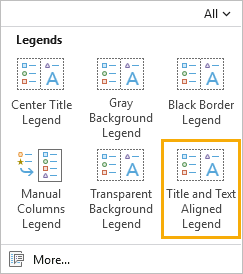
Each option formats the legend elements differently.
Draw a rectangle between the vertical guides at 8.25 and 10.75 inches.
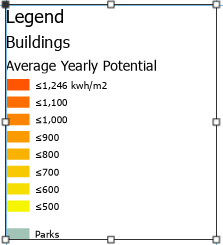
You'll change the default appearance to give the Parks layer a heading equivalent to the Buildings layer. You'll also remove the legend title.
In the Contents pane, under Layout Landscape, expand the Legend element, if necessary. Right-click the Parks legend element and click Properties
 .
.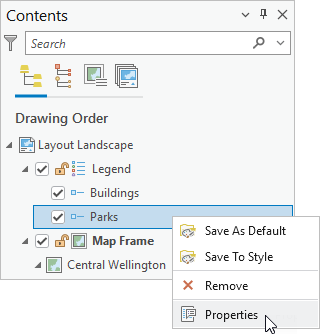
The Element pane appears.
Tip:
The Element pane allows you to work with the properties of individual legend items (represented in the Contents pane by the Legend Item symbol
 ). To work with the properties of the legend as a whole, right-click the Legend heading (represented by the Legend symbol ) and click Properties. Alternatively, right-click the selected legend on the layout.
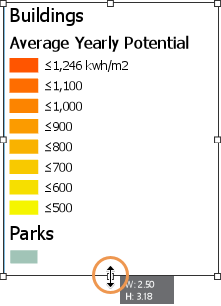
In the Element pane, under Show, check the Layer name check box to show the layer name as a heading.
Uncheck the Label (or layer name) check box.
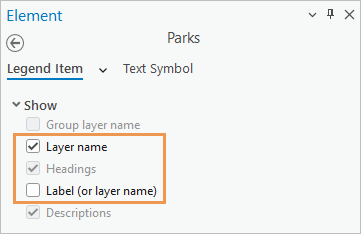
On the layout, the Parks layer name now appears above the symbol in a bold font and larger size.
In the Contents pane, click Legend
.The Element pane updates to show properties that belong to the legend as a whole. At the top of the pane, the Legend tab is selected. Under it, the Options tab
is selected.In the Legend section of the pane, uncheck the Show check box next to Title.
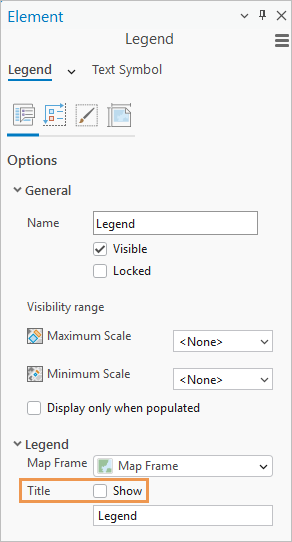
The default legend title is removed.
Close the Element pane.
On the layout, drag the legend so that the top of the rectangle snaps to the horizontal guide at 7.5 inches.
If necessary, resize the legend by dragging its bottom edge upwards so that the rectangle fits the legend element closely.
On the ribbon, click the Insert tab if necessary. In the Map Surrounds group, click the North Arrow drop-down arrow
 and click ArcGIS North 1 or any north arrow you like.
In the lower left corner of the layout, click to place a north arrow on the layout.
Drag the north arrow until it snaps to both the horizontal and vertical guides at 0.25 inches.
If you accidentally resize the element, click Undo
 on the Quick Access Toolbar.
Tip:
To zoom and pan on the layout page, click the Layout tab on the ribbon. In the Navigate group, click the Navigate tool
 . Then, to reposition an element, click the Select tool
  in the Elements group. To return to the full layout page extent, in the Navigate group, click Full Extent
  .
.On the Insert tab, in the Map Surrounds group, click the Scale Bar drop-down arrow
 . From the list of scale bars, under Metric, click Scale Line 1 Metric.
At the bottom of the layout, click to place the scale bar on the layout.
Drag the scale bar to the horizontal guide at 0.25 inches. Center it relative to the map frame or put it in a place that looks good to you.
Note:
As you move or resize layout elements, dashed blue horizontal and vertical lines may appear. These are smart guides, which help you align the selected element with other layout elements and with the layout page.
If necessary, resize the scale bar so that its maximum value is 1 kilometer.
Click an empty area of the layout to deselect the scale bar.
On the Quick Access Toolbar, click Save Project
.
Add a title and text
You'll add a map title and descriptive text.
On the Insert tab, in the Graphics and Text group, in the Graphics and Text gallery, click the Rectangle text tool
 .
.If your application window is not wide enough to display the gallery, click the gallery button drop-down arrow
 . Under Text, click the Rectangle text tool .
On the layout, above the map frame, draw a wide rectangle for your map title.
When you release the mouse button, the word Text appears inside a dashed outline of the box. The text is highlighted so you can edit it.
Type the following text: Solar Radiation for Buildings in Central Wellington.
When you're finished, click an empty area on the layout.
The text element is now selected on the layout.
On the ribbon, click the Text tab. In the Text Symbol group, change the text symbol font size to 22 pt. Change the text symbol font style from Regular to Bold.
Align the title with the vertical guide at 0.25 inches and the horizontal guide at 8.25 inches.
If necessary, widen the text element to see the full title.
Tip:
If a text element contains text that isn't displayed, an overflow icon
 appears next to the element.
Click an empty area on the layout to deselect the title.
Next, you'll add a short description to help readers understand the map.
On the Insert tab of the ribbon, in the Graphics and Text group, in the Graphics and Text gallery, click the Rectangle text tool
. On the layout, draw a box under the legend.Type or copy and paste the following text in the text rectangle: Average annual solar energy potential values for rooftops in kilowatt-hours per square meter. Dark orange colours indicate higher-yielding locations for installing solar panels or water heating. Three-dimensional roof information was used where available; other roof structures were assumed to be flat at an estimated height. Trees were omitted from the analysis.
Click an empty area on the layout to select the text element.
On the ribbon, click the Text tab. In the Text Symbol group, change the text symbol font size to 8 pt. Change the text color to Gray 50%.
Align the left side of the text element with the vertical guide at 8.25 inches. Align the right side with the vertical guide at 10.75 inches.
Resize the text rectangle so that it fits the text closely while showing all the text.
Click an empty area on the layout to deselect the text.
Note:
If spell-checking is enabled in the application, unrecognized words are marked with wavy underlines. These lines do not appear when the map is printed or exported as a file.
On the Quick Access Toolbar, click Save Project
.
Add dynamic text
In addition to static text, which doesn't change, you can add dynamic text. Dynamic text is linked to properties of the map or your computer's operating system and updates automatically when those properties change. For example, dynamic text can reflect the time the map was last saved or printed.
On the ribbon, click the Insert tab, if necessary. In the Graphics and Text group, click the Dynamic Text drop-down arrow
 . Under Map Frame, click Credits.
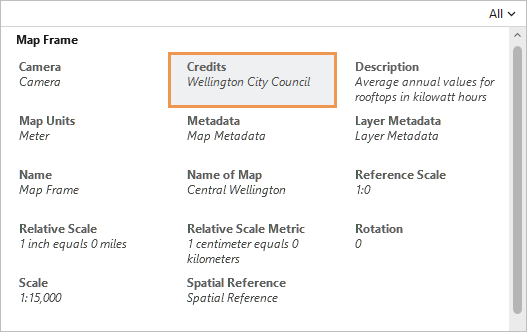
Click below the descriptive static text to add the dynamic text.
Align the dynamic text element with the vertical guide at 8.25 inches.
In the text element, the words Wellington City Council are dynamic. This information is a map property of the Central Wellington map and is automatically updated on the layout if the property is changed.
Tip:
To see the credits, make the Central Wellington map view active. In the Contents pane, right-click the map name and click Properties
. On the Map Properties dialog box, click the Metadata tab and look for the Credits box.In the layout view, right-click the selected dynamic text element and click Properties
. (You may need to scroll to the bottom of the context menu.)The Element pane appears. On the Text tab, on the Options tab
, under Text, the tag view button  is selected by default. In this view, dynamic text is displayed as a tag; other text is static and can be edited.
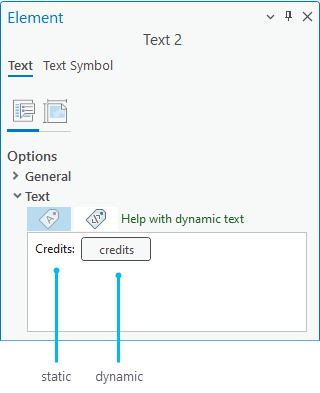
To see how dynamic text is formatted, hover over the tag or click the text view button
 .
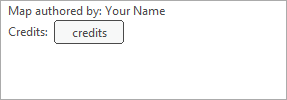
.In the text box, click in front of the word Credits (the static text, not the tag). Type Map authored by: and then type your name. Press the Enter key to make a line break.
At the top of the Element pane, click the Text Symbol tab. On the General tab
 , expand Appearance if necessary.
Change the Size setting to 8 pt and the Color setting to Gray 50% (row 6, column 1 on the color palette). Click Apply.
Tip:
You can make the same changes using the Text tab on the ribbon.
Close the Element pane.
Click an empty area on the layout to deselect the text.
On the Quick Access Toolbar, click Save Project
.
Add an overview map and extent rectangle
To show central Wellington in a larger geographic context, you'll create an overview map.
On the Insert tab, in the Map Frames group, click Map Frame
 . Under Region, click the second thumbnail image of the Region map (the one that uses a bookmark as its source).
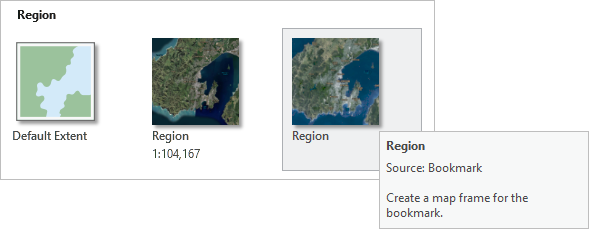
Draw a small rectangle for the map frame on top of the existing map frame.
The map frame is added to the layout. In the Contents pane, there are now two map frames: Map Frame 1 (the new map frame) and Map Frame. It will be easier to tell them apart if you rename them.
In the Contents pane, with Map Frame 1 selected, click the name Map Frame 1 to make it editable. Type Overview Map and press the Enter key.
In the Contents pane, click Map Frame to select it and click again to make its name editable. Type Main Map and press the Enter key.
Now you'll reshape the overview map.
In the Contents pane, click Overview Map to select it.
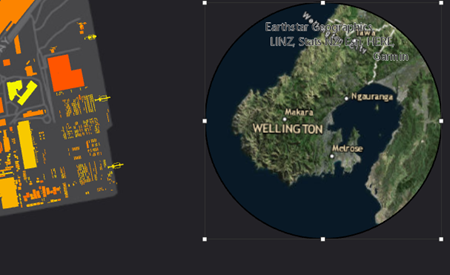
On the ribbon, click the Map Frame tab. In the Edit group, click the Reshape drop-down arrow and click Circle
 .
.On the layout, on the overview map, hover over the city of Wellington. Drag to draw a circle over the map frame.
Depending on the size of your map frame, your map may look different. The overview map frame is reshaped to a circle.
Drag the overview map to the upper right corner of the main map. Use the selection handles to resize the overview map so it looks good to you.
The map shows Wellington in a larger context, but it doesn't indicate the specific area covered by the main map. You'll add an extent rectangle to show this.
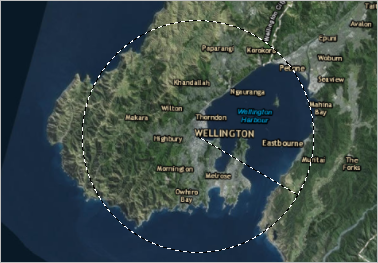
On the ribbon, click the Insert tab. In the Map Frames group, click Extent Indicator
 and click Main Map.
An extent indicator appears on the overview map, but it's black and hard to see against the imagery. An item named Extent of Main Map is added to the Contents pane and is selected.
On the ribbon, click the Map Frame tab.
In the Symbol group, confirm that the fill color is 100% transparent. Update the following settings:
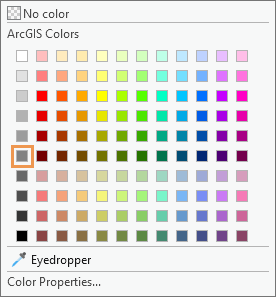
Click the Stroke drop-down arrow and choose a bright yellow color such as Solar Yellow (row 3, column 5 on the color palette).
Change the line width to 2 pt.
The extent indicator is now visible. Next, you'll adjust the scale and extent of the overview map.
On the ribbon, click the Layout tab. In the Map group, click Activate
. Zoom or pan the overview map to an extent you like.Tip:
Use Fixed Zoom In
 and Fixed Zoom Out
  on the ribbon, or set a value in the scale box at the bottom of the layout view.
On the ribbon, click the Layout tab. In the Map group, click Close Activation
.You'll give the overview map a lighter border to set it off from the surrounding black space.
In the Contents pane, click Overview Map to select it.
On the ribbon, click the Map Frame tab. In the Current Selection group, click the drop-down arrow and click Border.
In the Border group, update the following settings:
Click the Stroke drop-down arrow and change the color to Gray 50% (row 6, column 1 on the color palette).
Change the line width to 1.5 pt.
The map frame border is updated on the overview map.
Click an empty area on the layout to deselect the overview map.
Finally, you'll adjust the alignment of the elements in your layout.
Press and hold the Shift key. On the layout, select the legend and the two text elements under it.
All three elements appear with selection handles.
Right-click any of the selected elements, point to Distribute
 , and click Distribute Vertically
  .
.The vertical spacing between the elements is equalized. The effect is best if the legend and text rectangles don't include empty space at the bottom.
Click an empty area on the layout to deselect the elements.
On the Quick Access Toolbar, click Save Project
.
Export the layout
Now that the layout is finished, you can print it or export it to a file that can be easily shared. You'll export the layout as a .jpeg file.
On the ribbon, click the Share tab. In the Output group, click the Export Layout drop-down arrow
 and click Web JPEG
  .
.The Export Layout pane appears.
In the Name box, accept the default output location (the project's home folder) and file name. Alternatively, click Browse
and browse to the another location.Accept the other default JPEG settings. At the bottom of the pane, click Export.
Tip:
If you change any of the settings and want to reuse them for exporting other layouts, click Save Preset. Once the settings are saved, they appear in the gallery of layout export options.
When the export is completed, click View exported file at the bottom of the pane.
The file opens in your default image viewing application. If you want to print the layout, on the Share tab, in the Output group, click Print Layout
 . You may need to change some printer settings, such as the page orientation, before you send the layout to the printer.
In this tutorial, you used several layout elements. There are others, such as tables, charts, and grids and graticules, to try on your own. Each element you add to your layout has its own design and formatting options.
This layout serves a specific purpose—to show the solar energy potential for buildings in downtown Wellington. A layout can also be used as a template to generate a spatial map series: a collection of maps with a consistent design that represent different geographic extents.