Overlay methods
The overlay methods combine the multiple weighted transformed input rasters into a single output suitability map using various Multicriteria Decision Analysis (MCDA) overlay approaches.
A suitability model must capture the interactions of the subject to the criteria. Transforming the criteria identifies how the subject responds to the values within the criteria. Overlay methods allow you to capture the subject’s interaction between the criteria.
Similar to the transformations, each overlay method uniquely combines the weighted transformed criteria allowing you to realize the subject’s particular interactions between the criteria. If the model can better capture the unique interactions, the results will be more accurate.
Select a method
You can choose from the following Overlay method parameter options:
Weighted sum—Use when high values in a criterion can balance out low values. This is the most common method because often you want an overall score by adding weighted transformed criteria together. This is the default method.
Weighted geometric mean—Use when high values in a weighted transformed criterion cannot compensate for low values in other criteria. A single low value will reduce the final suitability because this is a multiplicative method, in which the weights are applied as exponents to each weighted transformed criterion value.
Maximum—Use when one high value in a weighted transformed criterion alone is enough to make a location suitable.
Minimum—Use when a single low value in a weighted transformed criterion should disqualify a location.
Weighted overlay—Use to assign each criterion a percent influence that adds up to 100. The results are rescaled to the defined suitability scale. When the Weight by parameter value is set to Multiplier on the Settings tab, the assigned weights will be internally recalculated as percent influences.
Ordered weighted averaging—Use to explore decision scenarios by adjusting the Order weights approach parameter value. This allows the final result to be more influenced by weighted transformed criteria that have higher or lower values.
Ideal point solution (TOPSIS)—Use to calculate the suitability value of each cell by how close it is to a specified ideal and least desired solutions. For each cell, the method calculates the distance (difference in the values) from the ideal and from the least desirable values and then combines these distances into an output cell value.
Overlay method calculations
The following describes each overlay method, provides the underlying formula, gives an illustration of the computations using a series of 3 by 3 cell rasters, and identifies potential applications for each method.
Weighted sum
Use the Weighted sum option of the Overlay method parameter when trade-offs among input criteria are acceptable. A high value in one criterion can compensate for a low value in another, producing a result that represents the overall combined performance or suitability across all input criteria.
Formula
For this method, the cell values from each transformed criteria are multiplied by their corresponding weight. The results are added together to create the output suitability raster.
Expressed as a formula, the output value for each location is calculated as follows:
\(OutRas = (Ras1 \times Weight1) + (Ras2 \times Weight2) + \ldots + (RasN \times WeightN)\)
Example
The illustration below shows the result of applying the formula to two transformed criteria with a different weight applied. These inputs will be used in the examples for all the other methods.
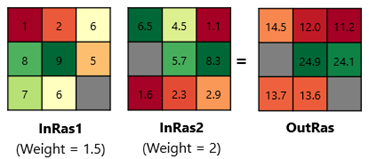
Consider the upper left cell. For InRas1, the location has a cell value of 1. Multiplying it by the weight of 1.5 results in a value of 1.5. For InRas2, the location has a cell value of 6.5, so the result of multiplying it by the weight of 2 is 13.
Adding the values 1.5 and 13 results in an output cell value of 14.5 for that location.
Potential applications
Applications for this method include the following:
Wind farm siting—In a wind farm site selection project, use this method to aggregate several criteria into a single suitability map. The method can capture how having excellent wind resources can outweigh conditions, such as moderate slope, based on their assigned importance.
Winery plantation planning—In vineyard site planning, the weighted sum method is used to combine natural climate conditions, cost-related factors, and soil properties into a final suitability score. High climate and soil suitability can offset less favorable cost conditions, considering long-term profits.
Weighted geometric mean
Use the Weighted geometric mean option of the Overlay method parameter for analyses in which all transformed criteria have relatively high values to achieve a high suitability value.
The calculation is based on multiplication, so a low value in any transformed criterion will proportionally reduce the final suitability and cannot be compensated for by higher values in other transformed criteria. It is often chosen to maintain the influence of low values as a limiting factor, while still incorporating contributions from other inputs. The exponential nature of the weights allows control over how strongly low values affect the outcome.
Formula
For this method, for each cell, the cell values from each transformed criterion are raised to the power of their corresponding weight. The results are multiplied and then the product is raised to the power of the sum of all the weights.
Expressed as formulas, first the sum of all the weights is calculated:
\(Weights\_sum = Weight1 + Weight2 + \ldots + WeightN\)
Next, all of the input cell values are raised to the power of their associated weight, and the product of those values is calculated:
\(Values\_product = Ras1^{Weight1} \times Ras2^{Weight2} \times \ldots \times RasN^{WeightN}\)
The final output value for each location is calculated by raising the product of the weighted values to the inverse sum of all the weights.
\(OutRas = Values\_product^{(1 / Weights\_sum)}\)
Example
The illustration below shows the result of applying this formula to the same inputs and the same weights used in the weighted sum method.
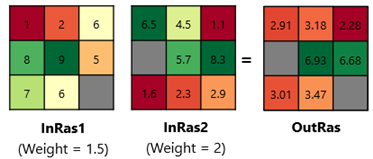
For InRas1, the upper left cell of value 1 is raised to the power of the weight. The result of 11.5 = 1.
For InRas2, the weight causes the input cell value of 6.5 to be raised to the power of 2, which results in a value of 42.25.
The product of 1 and 42.25 is 42.25. The sum of the weights is 1.5 + 2 = 3.5.
The final output for that location is 42.25(1 / 3.5) ≈ 2.91.
Potential applications
Applications for this method include the following:
Habitat suitability index—In habitat modeling, multiple criteria—such as water quality, temperature, and light availability—are combined using a weighted geometric mean so a site cannot score highly unless all essential habitat conditions are favorable.
Aquaculture site suitability and yield estimation—In farming site evaluation, several environmental quality criteria are aggregated with a weighted geometric mean so overall suitability drops sharply when any critical environmental condition is poor.
Maximum
Use the Maximum option of the Overlay method parameter when the weighted transformed criterion can substitute for one another and you want the result to reflect the strongest advantage or highest value at each cell rather than overall balance. A cell receives a high output value when at least one of the weighted transformed criterion has a high value, even if the other weighted transformed values are low.
Formula
For each input cell, the tool will assign the largest value among the weighted transformed criterion at that location.
The formula for calculating the maximum of the weighted transformed criterion for each location is as follows:
\(OutRas = Maximum\{(Ras1 \times Weight1), (Ras2 \times Weight2), \ldots, (RasN \times WeightN)\}\)
Example
The results of applying this formula to the same inputs and the same weights are as follows:
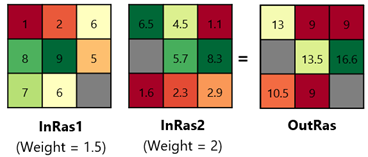
For InRas1, the upper left cell value of 1 is multiplied by the weight of 1.5, resulting in a value of 1.5. For InRas2, the cell value of 6.5 is multiplied by the weight of 2, which results in 13.
This method returns the largest of the two weighted values, so the output value will be 13.
Potential applications
Applications for this method include the following:
Mineral exploration—In cobalt prospectivity mapping, multiple criteria are combined using the Maximum overlay method so a cell is highlighted if any one indicator strongly supports mineral potential.
Wireless coverage mapping—In radio network planning, signal strength rasters from multiple base stations are combined using the Maximum overlay method so each cell represents the strongest available coverage at that location.
Minimum
Use the Minimum option of the Overlay method parameter when you want the result to reflect the most limiting factor at each cell. A cell will receive the lowest value of the weighted transformed criterion, even if other weighted transformed criteria are high.
Formula
For each input cell, the tool will assign the smallest value among the weighted transformed criterion at that location.
The formula for calculating the minimum of the weighted transformed criteria for each location is as follows:
\(OutRas = Minimum\{(Ras1 \times Weight1), (Ras2 \times Weight2), \ldots, (RasN \times WeightN)\}\)
Example
The results of applying this formula to the same inputs and the same weights are as follows:
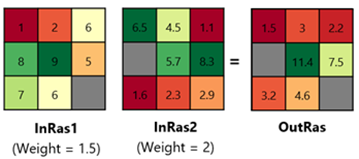
The upper left cell value of InRas1 is 1, and multiplying by the weight of 1.5 resulting in the value 1.5. For InRas2, the cell value of 6.5 is multiplied by the weight of 2, which results in 13.
This method returns the lowest of the two weighted values, so the output value will be 1.5.
Potential applications
Applications for this method include the following:
Habitat suitability—In habitat modeling, food and water availability, land-use type, and human disturbance are all considered key limiting factors. They are combined using the Minimum overlay method so a cell is rated low if any essential habitat conditions are poor.
Solar farm siting with multiple submodels—Three submodels suitability maps are created for solar resource suitability, accessibility, and environmental impact. Because solar resource suitability is treated as a limiting factor, the Minimum method is used to derive the final suitability, ensuring that locations with poor solar potential remain low in suitability even if other conditions are favorable.
Weighted overlay
Use the Weighted overlay option of the Overlay method parameter when you want each criterion to contribute to the result as a percentage of the final output. Often, when using this method, Percent is selected as the Weight by parameter on the Settings tab. As a result, the weights are percentages and must sum to 100. Each percent value indicates how strongly each criterion influences the final output relative to the other criteria.
The combined result is then rescaled to the suitability scale defined by the Set suitability scale parameter on the Settings tab, such as 0 and 1 or 1 and 10. This ensures that the suitability map values stay within a consistent range, allowing you to directly compare results generated from different input criteria or weighting settings.
When the Weight by parameter value is set to Multiplier on the Settings tab, the assigned weights will be internally recalculated as percent influences.
Formula
For each location, corresponding cell values in each transformed criterion are multiplied by the value provided for the Percent option. All the weighted values are added together. That result is then scaled to the defined output range.
The output value for each location is calculated as follows:
\(CombinedValue = (Ras1 \times Percent1) + (Ras2 \times Percent2) + \ldots + (RasN \times PercentN)\)
Then the weighted summed output is rescaled using the formula below:
\(OutRas = {FromScale} + ({CombinedValue} - {CombinedValue}_{\min}) \cdot \large \frac {ToScale - FromScale}{CombinedValue_{\max} - CombinedValue_{\min}}\)
Example
The result of applying this formula follows. The output scale chosen for this example is 1-10.
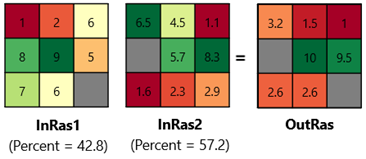
For InRas1, the upper left cell of value 1 multiplied by the decimal percentage 0.428 = 0.428. For InRas2, the cell value of 6.5 multiplied by the decimal percentage 0.572 = 3.718.
The sum of these two values is 4.146.
The tool then performs these calculations for all nine input locations. The resulting minimum value is 3.197, and the maximum value is 7.112.
Applying these values to the formula results in the following final output value for this location:
\(\begin{aligned}OutRas &= 1 + (4.146 - 3.1972) \cdot \frac{10 - 1}{7.1124 - 3.1972} \\ &= 3.2\end{aligned}\)
Potential applications
Because this method uses an additive combination, its applications are similar to Weighted sum, but the weights are expressed as percentages and the final values stay within the specified range.
Ordered weighted averaging
Use the Ordered weighted averaging option of the Overlay method parameter when you want to emphasize the high weighted transformed criterion or when you want to explore how sensitive results are to different levels of trade-off and compensation
Unlike methods that apply fixed weights to fixed criteria positions, Ordered weighted averaging (OWA) first sorts the weighted transformed criterion values at each cell from highest to lowest. It then applies a separate set of order weights to the ranked values that control how much influence the best, middle, or worst transformed criterion has.
Use the ability to customize the order weight settings to control how high values can offset low values across the weighted transformed criteria and to approximate the results of different overlay methods.
If you assign an order weight of 1 to the highest weighted transformed criterion and 0 to all others, OWA behaves like the Maximum method where the weighted high transformed criterion values have the most influence.
If you assign an order weight of 1 to the lowest weighted transformed criterion and 0 to all others, OWA behaves like the Minimum method where the weighted low transformed criterion values strongly limit the output.
If you give equal order weights to all ranked values, OWA behaves like a Weighted sum method, in which weighted transformed criteria contribute evenly to the result.
There are three ways to specify the order weights: Custom, Quantifier-guided, and Maximum entropy.
When the Order weights approach parameter value is set to the Custom option, you can enter the weights manually.
The Quantifier-guided and Maximum entropy options derive order weights automatically. Both approaches use an Orness parameter value to control the shape of the order weights. Orness describes how optimistic the overlay is. Higher values give more influence to the highest-ranked weighted transformed criterion value. Lower values give more influence to the lowest-ranked weighted transformed criterion value.
The difference between the two automatic approaches is how the order weights are distributed. Quantifier-guided approach produces a regular increasing or decreasing rank pattern while Maximum entropy produces a more dispersed rank pattern.
Formula
For each input raster, multiply every cell value by the value of the defined weight for that transformed criterion. Next, for each cell location, rank the weighted transformed values from highest to lowest. Multiply the sorted values by the order weights and then sum them together to produce the final output value for that cell.
First, calculate the weighted input value for each input location.
\(WeightedInput1 = Ras1 \times Weight1\)
\(WeightedInput2 = Ras2 \times Weight2\)
\(\ldots\)
\(WeightedInputN = RasN \times WeightN\)
Next, the weighted values will be ranked from highest to lowest.
\(Ranked\_values = \{Rank1(WeightedInput1), Rank2(WeightedInput2), \ldots, RankN(WeightedInputN)\}\)
A list of order weight values will either be provided as input or can be generated by the tool.
\(List\ of\ weight\ values = \{RankWeight1, RankWeight2, \ldots, RankWeightN\}\)
The order weight values are multiplied by the ranked weighted values and then summed together to provide the value for that cell location in the final output raster.
\[ \begin{array}{l} OutRas = (RankWeight1 \times Rank1(WeightedInput1)) + (RankWeight2 \times Rank2(WeightedInput2)) \\ \phantom{OutRas = {}} + \ldots + (RankWeightN \times RankN(WeightedInputN)) \end{array} \]
Example
Applying this method to the example inputs results in the following output:
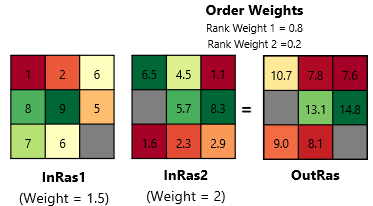
For InRas1, the value of the upper left cell location is multiplied by the weight, and the result of 1 x 1.5 = 1.5. For InRas2, the result is 6.5 x 2 = 13.
The weighted values for this location ranked from highest to lowest are 13 and 1.5.
The provided order weights 0.8 and 0.2 are applied to the ranked values. For InRas2, the result is 13 x 0.8 = 10.4. For InRas1, the result is: 1.5 x 0.2 = 0.3.
The sum of these two values is 10.4 + 0.3 = 10.7.
Potential applications
Applications for this method include the following:
Integrated agricultural planning—By applying different combinations of order weights, you can compare an output suitability map that does the following:
Enforces strict limiting criteria for reliable long-term production.
Highlights high-potential opportunities for near-term expansion.
Reveals balanced strategies that emphasize moderately suitable areas, avoiding extremes, which can be useful for risk-averse planning.
Landslide susceptibility mapping—You can adjust the order weights to control how much trade-off is allowed among landslide factors, such as slope, rainfall, geology, and land cover.
This makes it possible to compare susceptibility maps that do the following:
Apply a strict, limiting factor rule with little or no trade-off.
Use a more permissive rule where strong factors can have greater influence.
Test intermediate strategies that allow partial compensation among criteria.
Ideal point solutions (TOPSIS)
Use the Ideal point solutions (TOPSIS) option of the Overlay method parameter when you want a balanced compromise solution. This option identifies locations that simultaneously favor being near desirable conditions and are far from undesirable conditions. Unlike the others, this method can optimize more than one factor.
An Ideal Positive point (most preferred) and an Ideal Negative point (least preferred) for each criterion are derived from the transformation applied to the criteria. The Ideal Positive and Ideal Negative points often are the maximum and minimum of the transformed criteria. However, there are certain situations such as applying the Gaussian function that might be used to transform aspect, in which the midpoint may be the ideal positive point with the low and high criterion values being assigned as the ideal negative points. You control the ideal positive and negative values through the transformation you select.
For reference, the values displayed in the Criteria table on the Suitability tab are the original criterion values that map to the highest and lowest transformed values. The values in the table cannot be changed. In certain continuous functions such as MSSmall, a range of criterion values will be assigned the maximum value, for example >1230 meters. As in the Gaussian example above, there will be two entries for the ideal negative, for example 0 and 360.
By setting the thresholds in continuous functions, the ideal positive and negative values do not need to be within the range of the criterion values. For example, when creating an air quality index, one important criterion is PM2.5 concentration (lower is better). In your dataset, neighborhoods in the city range from 18 μg/m³. If you use the World Health Organization guideline 5 μg/m³ as the ideal value, that ideal point is below the minimum in the input raster range. This type of scenario can be handled using threshold parameters in a continuous function. The function is fitted between the specified threshold values allowing you to define ideal values that extend beyond the observed range of the input data. TOPSIS can still use it as a reference to measure how close each cell value is to the ideal, even if no location in the city currently meets that standard.
To learn more about working with thresholds in continuous functions, see The interaction of the lower and upper thresholds on the output values for Rescale by Function.
Formula
For the TOPSIS algorithm, a positive ideal point (highest preferred) and a negative ideal point (lowest reference) for each criterion are identified based on the applied transformation. Each transformed criterion is multiplied by its assigned weight. Next, the difference of each cell value to the ideal positive solution and the ideal negative solution values are calculated. The final output is determined by the relative closeness coefficient, which is calculated from each cell's distance (difference in the values) to the positive ideal solution and the negative ideal solution. In general, higher values represent more preferred cells because they are relatively closer to the ideal positive solution and relatively farther from the ideal negative solution.
Use the Transformation pane in the Suitability Modeler to transform each criterion using an appropriate transformation method.
At each cell in the transformed criterion, TOPSIS computes the cell's distance, the difference of each cell value, to the ideal positive solution and to the ideal negative solution values using the selected distance method. Then, the criterion raster weights are applied to the distance calculation so that more important criteria contribute more to the positive and negative distances.
The Distance Method parameter provides two options for calculating distance: Euclidean distance and Manhattan distance.
For Euclidean distance, the weighted distances are computed as follows:
\(\large d_{i}^{+} = \sqrt{\sum_{j=1}^{m} \frac{w_j}{\sum_{k=1}^{m} w_k}(x_{ij} - x_{j}^{+})^{2}}\)
\(\large d_{i}^{-} = \sqrt{\sum_{j=1}^{m} \frac{w_j}{\sum_{k=1}^{m} w_k}(x_{ij} - x_{j}^{-})^{2}}\)
For Manhattan distance, the weighted distances are computed as follows:
\(\large d_{i}^{+} = \sum_{j=1}^{m} \frac{w_j}{\sum_{k=1}^{m} w_k}\left|x_{ij} - x_{j}^{+}\right|\)
\(\large d_{i}^{-} = \sum_{j=1}^{m} \frac{w_j}{\sum_{k=1}^{m} w_k}\left|x_{ij} - x_{j}^{-}\right|\)
where:
\(d_{i}^{+}\) is the weighted distance from cell \(i\) to the positive ideal solution.
\(d_{i}^{-}\) is the weighted distance from cell \(i\) to the negative ideal solution.
\(x_{ij}\) is the original value of cell \(i\) for input criterion \(j\).
\(x_{j}^{+}\) is the positive ideal value for criterion \(j\).
\(x_{j}^{-}\) is the negative ideal value for criterion \(j\).
\(m\) is the number of input criteria.
\(w_j\) is the weight assigned to input criterion \(j\).
\(\large \sum_{k=1}^{m} w_k\) is the sum of the weights of all input criteria.
The ratio \(\Large \frac{w_j}{\sum_{k=1}^{m} w_k}\) represents the normalized weight of raster \(j\).
The two distances are converted to a single closeness score using the formula below:
\(OutRas = \frac{\large d_i^{-}}{\large d_i^{+} + d_i^{-}}\)
Example
Applying this method to the example inputs results in the following output.
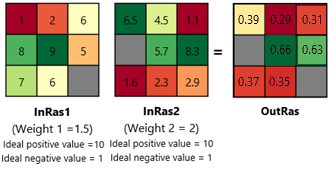
TOPSIS typically includes a standardization step to place all input criteria on a common scale before calculating distances to the positive and negative ideal solutions. In Suitability Modeler, this step is addressed during the transformation stage, in which each criterion is transformed to a common suitability scale. In this example, the raster values shown already represent transformed suitability values on a 1 to 10 scale. Therefore, no additional standardization is necessary during the TOPSIS calculation.
Since all criteria are on the same suitability scale, the maximum value of the suitability scale is used as the Ideal Positive Values and the minimum value is used as the Ideal Negative Values for all input criteria. Therefore, in this example, which uses a suitability scale of 1 to 10, the positive ideal value is 10 and the negative ideal value is 1 for each criterion.
Compute the distance to the positive ideal and negative ideal with weights applied.
For ideal positive distance:
\(d^{+} = \sqrt{\frac{1.5}{1.5\ +\ 2}(1 - 10)^2+\frac{2}{1.5\ +\ 2}(6.5 - 10)^2} = 6.459\)
For ideal negative distance:
\(d^{-} = \sqrt{\frac{1.5}{1.5\ +\ 2} (1 - 1)^2 + \frac{2}{1.5\ +\ 2} (6.5 - 1)^2} = 4.158\)
Compute the final TOPSIS score:
\(Out_{cell} = \frac{4.158}{4.158\ +\ 6.459} = 0.392\)
Potential applications
Applications for this method include the following:
Sustainable urban development—Use TOPSIS when you want to identify areas that are most suitable for sustainable urban development based on multiple indicators, such as access to public transit, vegetation coverage, and pollution exposure. The method compares each location to an ideal set of desirable conditions and to an opposite set of undesirable conditions. Areas closer to the ideal positive solution and farther from the ideal negative solution receive higher suitability values, helping planners identify locations that better support sustainable development goals.
Solid waste disposal site suitability—Use TOPSIS to combine multiple criteria to find a suitable solid waste disposal location. Favorable conditions (sites that are environmentally safer, technically feasible, and less likely to affect nearby communities) define the ideal positive solution, while unfavorable conditions (locations close to settlements or water bodies, or areas with unsuitable terrain and land use) define the ideal negative solution. TOPSIS helps you identify sites that are simultaneously closest to the desired disposal conditions and farthest from unsuitable conditions.