Probabilistic Kernel Density (Spatial Analyst Tools)
Summary
Estimates a magnitude-per-unit area from point features while quantifying associated sampling, location, and attribute -based uncertainty.
One or more uncertainty types (sampling, location, or attribute) are propagated into the estimate to produce a mean density raster and optional standard deviation, coefficient of variation, and exceedance probability rasters.
Illustration
Usage
This tool estimates the density surface specified number of times under a model of uncertainty in the input data. The primary output is a mean density raster, accompanied by optional rasters that describe the uncertainty of that estimate
Very large or very small values in the Population field (
population_fieldin Python) parameter can produce results that may seem nonintuitive. If the mean of the population field is much larger than 1, the default search radius may be very small. If the mean is much smaller than 1, the calculated search radius may seem unreasonably large. In these cases, you can enter your own search radius.The Uncertainty Type (
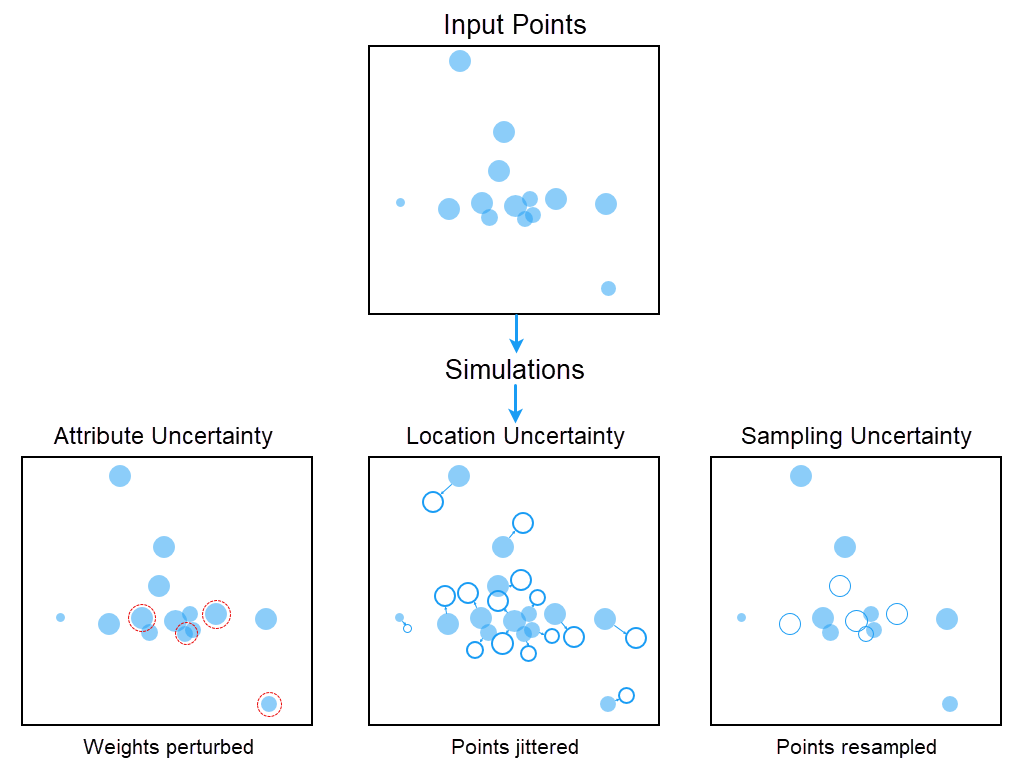
uncertainty_typein Python) parameter dictates what uncertainty will be incorporated in the density estimation. Any combination of Sampling, Location, and Attribute options can be selected. On the tool dialog box, each selected type reveals only its own subparameters.The Sampling type represents sampling uncertainty by resampling the events from the input with or without location displacement (bootstrap). It enables the Percentage of Data to Sample (
sample_pctin Python) parameter. A lower percentage value for sampling will widen the uncertainty bands.The Location type represents positional uncertainty by offsetting each event by the specified displacement amount. It enables the Location Displacement Factor (
jitter_factorin Python) parameter, which sets the offset as a fraction of the search radius.The Attribute type represents uncertainty in the Population Field weights. It enables the Attribute Error Type (
attr_error_typein Python), Distribution Method (distribution_methodin Python), and Attribute Error Percentage (attr_error_pctin Python) parameters. The distribution can be Normal, Lognormal, Uniform, or Triangular.The Number of Simulations (
n_simsin Python) parameter controls the number of times the density estimation is repeated under the specified Uncertainty Type value. Increasing this number generally leads to more reliable estimates but also increases computation time. The default is 200.Using the same inputs and the same Random Seed (
seed_valuein Python) parameter value will produce identical results, so change the seed value to obtain an independent but statistically consistent run.The Percentage of Data to Sample (
sample_pctin Python) parameter applies only to the bootstrap-based Sampling Method (sampling_methodin Python) parameter options. Lower values increase the variability between simulations and widen the uncertainty bands. Because each simulation is normalized by its resampled total, values well below 100 also reduce the overall magnitude of the mean surface.The Location Displacement Factor (
jitter_factorin Python) parameter is available when the Uncertainty Type parameter selection includes Location as an option. It sets the positional offset as a fraction of the search radius, so it should reflect the positional accuracy of the input data.When the Uncertainty Type parameter value is set to Attribute, a valid Population Field parameter value is required for the uncertainty type to work. If no value is provided, weights for all features will be set to 1.
Larger values of the Search Radius (
search_radiusin Python) parameter produce a smoother, more generalized density raster. Smaller values produce a raster that shows more detail. When the search radius is left empty, a default is calculated from the spatial configuration and number of input points, correcting for spatial outliers so they do not make the search radius unreasonably large.The Output Cell Size (
cell_sizein Python) parameter can be defined by a numeric value or obtained from an existing raster dataset. If the cell size is specified using a raster dataset, the parameter will show the path of the raster dataset instead of the cell size value. If the cell size hasn't been explicitly specified as the parameter value, it is derived from the Cell Size environment if it has been specified. If neither the parameter cell size nor the environment cell size have been specified, but the Snap Raster environment has been set, the cell size of the snap raster is used. If nothing is specified, the cell size is calculated from the shorter of the width or height of the extent divided by 250 in which the extent is in the output coordinate system specified in the environment.If the Densities option is specified for the Output Cell Values (
out_cell_valuesin Python) parameter value, the values represent the kernel density per unit area for each cell. If the Expected Counts option is specified, the values represent the count within each cell area. The equation that relates the two is Count = Density * Area.The Method (
methodin Python) parameter specifies how distance between locations and sites is computed as follows:Planar–Distances are calculated in a flat, projected coordinate space using Cartesian geometry. This method is appropriate for local or regional analyses where projection distortion is minimal.
Geodesic–Distances are calculated along the surface of the Earth (great-circle distance). This method should be used for global or large-area analyses, especially when input data is in a geographic coordinate system.
Use the Planar method for local-scale analysis in a distance-preserving projection, and the Geodesic method for regional or large-scale analysis or for data in a geographic or Web Mercator coordinate system.
The optional Output Standard Deviation Raster (
out_standard_dev_rasterin Python), Output Coefficient of Variation Raster (out_coefficient_variation_rasterin Python), and Output Exceedance Probability Raster (out_exceedance_probability_rasterin Python) parameters are produced only when a path is provided for them.The Output Exceedance Probability Raster parameter additionally requires a Probability Threshold Percentile (
prob_threshold_percentilein Python) parameter value. Cells with a mean density of zero or below are assigned NoData in the Output Coefficient of Variation Raster parameter.For data formats that support Null values, a Null value will be ignored when used as input.
See Analysis environments and Spatial Analyst for additional details about the geoprocessing environments that apply to this tool.
Parameters
| Label | Explanation | Data type |
|---|---|---|
|
Input Point Features |
The input point features for which density will be calculated. |
Feature Layer |
|
Population Field |
The field denoting population values for each point. The field can be a count or a quantity that will be used to spread across the surface to create a continuous density. If no field is provided, each point will be counted once. |
Field |
|
Uncertainty Type |
Specifies the sources of uncertainty that will be propagated into the density estimate. Any combination of values can be selected. Each selected type reveals only its own subparameters on the dialog box.
|
String |
|
Output Density Calculation Method (Optional) |
Specifies the statistic that will be used to summarize the simulated surfaces into the primary output raster.
|
String |
|
Number of Simulations (Optional) |
The number of times the tool will generate output density surfaces. The aggregate surface will be reported using the selected Output Density Calculation Method option. The value can range from 10 to 10,0000. A larger number of simulations will produce a more stable mean and uncertainty estimates. The default number of simulations is 200. |
Long |
|
Random Seed (Optional) |
The seed for the random draws. The same inputs and seed value will always produce identical results. Change the seed value for an independent but statistically consistent run. The default is 10. |
Long |
|
Sampling Strategy (Optional) |
Specifies how the random draws that drive the simulations are generated. All strategies are unbiased. They differ in how quickly the estimates stabilize.
|
String |
|
Sampling Method (Optional) |
Specifies how the sampled points are selected and replaced from the input data. This parameter is only available when the Uncertainty Type parameter is set to the Sampling option.
|
String |
|
Percentage of Data to Sample (Optional) |
The size of the resampling as a percentage of the number of events. Lower values increase the variability between simulations and widen the uncertainty bands. This parameter is only available when the Uncertainty Type parameter is set to the Sampling option. The default is 90. |
Double |
|
Location Displacement Factor (Optional) |
The positional offset that will be applied to each event as a fraction of the search radius. Set it to reflect the positional accuracy of the input data. The default is 0.05, and the value can range from 0.001 to 1.0. This parameter is only available when the Uncertainty Type parameter is set to the Location option. |
Double |
|
Attribute Error Type (Optional) |
Specifies how the uncertainty in the population-field weights will be defined. This parameter is only available when the Uncertainty Type parameter is set to the Attribute option.
|
String |
|
Distribution Method (Optional) |
Specifies the distribution used to perturb the weights. All options use the original weight as the mean and the standard error as the spread. Changing the distribution will only change the shape of the uncertainty. It will not change the magnitude of the weight. This parameter is available when Attribute is selected as the Uncertainty Type value.
|
String |
|
Margin-of-Error Field (Optional) |
A numeric field giving the margin of error of each weight. This parameter is available when Margin-of-Error Field is selected as the Attribute Error Type parameter value. |
Field |
|
Margin-of-Error Confidence Level (Optional) |
Specifies the confidence level of the margin of error (MOE) that will be used to convert it to a standard error. This parameter will be enabled when the Attribute Error Type parameter is set to Margin-of-error field.
|
String |
|
Attribute Error Percentage (Optional) |
The percentage error applied to each weight to derive its standard error. This parameter will be enabled when the Attribute Error Type parameter value is Fixed Percentage of Value. The default is 10. |
Double |
|
Search Radius (Optional) |
The search radius (bandwidth) within which density will be calculated, in the linear units of the output spatial reference. Larger values produce a smoother, more generalized raster; smaller values show more detail. If left empty, a default value is computed from the spatial configuration and number of input points using a spatial variant of Silverman's Rule of Thumb. |
Double |
|
Output Cell Size (Optional) |
The cell size of the output rasters. It can be defined by a numeric value or obtained from an existing raster dataset. If not specified, it is derived from the environment or calculated as the shorter of the extent width or height divided by 250. |
Analysis Cell Size |
|
Area Units (Optional) |
Specifies the area units that will be used for the output density values. A default unit is determined based on the linear unit of the output spatial reference. You can change this to the appropriate unit to convert the density output. Values for line density convert the units of both length and area. If no output spatial reference is specified, the output spatial reference will be the same as the input feature class. The default output density units are determined by the linear units of the output spatial reference. If the output linear units are meters, the output area density units will be set to Square kilometers. If the output linear units are feet, the output area density units will be set to Square miles. If the output units are anything other than feet or meters, the output area density units will be set to Square map units. That is, the output density units will be the square of the linear units of the output spatial reference. For example, if the output linear units are centimeters, the output area density units will be Square map units, which will result in square centimeters. If the output linear units are kilometers, the output area density units will be Square map units, which will result in square kilometers.
|
String |
|
Output Cell Values (Optional) |
Specifies what the values in the output raster represent. Because the cell value is linked to the cell size, the output raster cannot be resampled to a different cell size.
|
String |
|
Method (Optional) |
Specifies whether the flat earth (planar) or the shortest path on a spheroid (geodesic) method will be used.
|
String |
|
Output Standard Deviation Raster (Optional) |
The output raster with the standard deviation of density across simulations at each cell. It is a direct measure of uncertainty in the density units. |
Raster Dataset |
|
Output Coefficient of Variation Raster (Optional) |
The output raster with the coefficient of variation (standard deviation divided by mean) at each cell. It expresses uncertainty relative to the estimate. Cells with a mean of zero or below are assigned NoData. |
Raster Dataset |
|
Output Exceedance Probability Raster (Optional) |
The output raster with the exceedance probability where individual cell density value exceeds the threshold value. The exceedance probability will be computed as the fraction of simulations that exceed the threshold. Values range from 0 to 1. When this parameter is specified, the Probability Threshold Percentile parameter will be enabled. |
Raster Dataset |
|
Probability Threshold Percentile (Optional) |
The percentile of the Output Density Raster parameter value that will be used as the threshold for the Output Exceedance Probability Raster parameter. The threshold is computed once from the completed density surface, so no absolute density value is required. The default is 90. This parameter is only available when a valid path is specified for the Output Exceedance Probability Raster parameter value. |
Double |
Return value
| Label | Explanation | Data type |
|---|---|---|
|
Output Density Raster |
The output density raster. The value in each cell is the Mean, Median, Minimum, or Maximum of the simulated surfaces, as set by the Output Density Calculation Method parameter value. |
Raster |
Environments
Auto Commit, Cell Size, Cell Size Projection Method, Current Workspace, Extent, Geographic Transformations, Mask, Output CONFIG Keyword, Output Coordinate System, Parallel Processing Factor, Scratch Workspace, Snap Raster, Tile Size
Licensing information
- Basic: Requires Spatial Analyst
- Standard: Requires Spatial Analyst
- Advanced: Requires Spatial Analyst
References
See the following references for additional information:
Heuvelink, G. B. M. 1998. Error propagation in environmental modelling with GIS. London, England: Taylor & Francis. https://doi.org/10.1201/9780203016114
Heuvelink, G. B. M., Burrough, P. A., and Stein, A. 1989. "Propagation of errors in spatial modelling with GIS". International Journal of Geographical Information Systems, 3(4), 303–322. https://doi.org/10.1080/02693798908941518
Leung, Y., Ma, J. H., and Goodchild, M. F. 2004. "A general framework for error analysis in measurement-based GIS". Journal of Geographical Systems, 6(4), 325–354, https://doi.org/10.1007/s10109-004-0143-2
Silverman, B. W. 1986. Density Estimation for Statistics and Data Analysis. New York: Chapman and Hall.