Bivariate Spatial Association (Lee's L) (Spatial Statistics Tools)
Summary
Calculates the spatial association between two continuous variables using the Lee's L statistic.
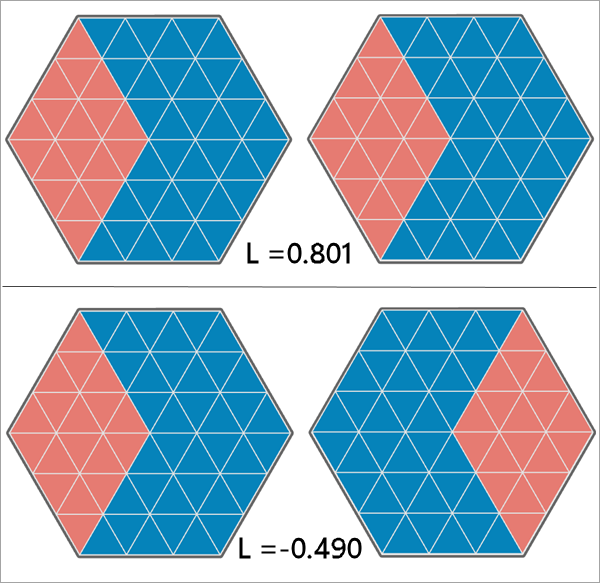
The Lee's L statistic characterizes both the degree of correlation and the degree of copatterning (similarity of spatial clustering) between the variables. The value will be between -1 and 1 and is conceptually similar to a correlation coefficient but is adjusted to account for spatial autocorrelation of the two variables. Lee's L values close to 1 indicate that the variables are highly positively correlated and that each variable has high spatial autocorrelation (high and low values of the variables each tend to cluster together). Values close to -1 indicate that the variables are highly negatively correlated and that each variable has highly positive spatial autocorrelation. Values close to 0 indicate that the variables are uncorrelated, not spatially autocorrelated, or both.
The Lee's L statistic can be partitioned to each input feature, called local Lee's L statistics, that show the local spatial association of the feature and its neighbors. This can be used to determine areas that have higher or lower spatial association than the global Lee's L statistic. The local statistics can also be classified into one of several categories based on the values of the neighbors of each feature. Both the global and local statistics are tested for statistical significance using permutations.
Learn more about how Bivariate Spatial Association (Lee's L) works
Illustration
Usage
The two analysis variables must be continuous (not binary or categorical), and the variables should have a linear relationship. If the relationship is not linear, use the Transform Field tool to apply transformations to the analysis variables to linearize the relationship and rerun the tool with the transformed values.
The tool returns a variety of outputs that allow you to investigate the spatial association between the two analysis variables. The geoprocessing messages display the Lee's L statistic and the p-value, and the output feature class contains fields summarizing the local Lee's L statistics, p-values, and statistical significance results. When run in an active map, the output feature layer will draw based on the local spatial association categories:
Not Significant,High-High,Low-Low,High-Low, andLow-High. For example, if the local Lee's L statistic is at least 90 percent statistically significant, the first analysis variable is higher than the mean value, and the second variable is lower than the mean value, the category will beHigh-Low.The p-values for testing the global and local spatial associations for statistical significance are calculated using permutations.
Use at least 50 input features and include at least 8 neighbors for each feature.
The neighborhoods of each feature always include the feature. If a spatial weights file is used to define neighbors, a weight of 1 will be defined for the weight of a feature to itself, even if the spatial weights file does not have the weight defined. The weights of each neighborhood are row standardized so that they sum to 1.
The Random Number Generator environment can be used to reproduce the permutations and p-values. If no seed value is specified, the global and local p-values may change due to randomness. However, If the Parallel Processing Factor environment is set to a value larger than 1 (the default), the permutations will not be consistent, even with a fixed seed value of the random number generator.
Reversing the order of the two analysis variables will not change the global or local Lee's L statistics, but the p-values may change due to randomness of the permutations. The
High-LowandLow-Highcategories will also reverse.
Parameters
| Label | Explanation | Data type |
|---|---|---|
|
Input Features |
The input features containing the fields of the two analysis variables. |
Feature Layer |
|
Analysis Field 1 |
The field of the first analysis variable. The field must be numeric. |
Field |
|
Analysis Field 2 |
The field of the second analysis variable. The field must be numeric. |
Field |
|
Output Features |
The output features containing the local Lee's L statistics, spatial association categories, p-values, and the weighted averages of the neighbors of each feature. |
Feature Class |
|
Neighborhood Type (Optional) |
Specifies how neighbors of each feature will be determined. The feature is always included in the neighborhood, and all neighborhood weights are normalized to sum to 1.
|
String |
|
Distance Band (Optional) |
The distance band that will be used to determine neighbors around the focal feature. If no value is provided, the distance will be the shortest distance such that each feature has at least one other neighbor in its neighborhood. For polygons, the distance between centroids will be used to determine neighbors. |
Linear Unit |
|
Number of Neighbors (Optional) |
The number of neighbors around each feature that will be included as neighbors. The value does not include the feature. For example, specifying 6 will use the feature and its six closest neighbors (seven features total). The default is 8. The value must be at least 2. |
Long |
|
Weights Matrix File (Optional) |
The path and file name of the spatial weights matrix file that defines the neighbors and weights between features. |
File |
|
Local Weighting Scheme (Optional) |
Specifies the weighting scheme that will be applied to neighbors when calculating spatial associations.
|
String |
|
Kernel Bandwidth (Optional) |
The bandwidth for the bisquare kernel. The bandwidth defines how quickly the weights decrease with distance. Larger bandwidths will provide comparatively larger weights to neighbors that are farther away from the feature. For the k nearest neighbors neighborhood, the default value (empty) will use an adaptive bandwidth equal to the distance to the (k+1)th neighbor of the focal feature. For the fixed distance band neighborhood, the default (empty) will use the same value as the distance band. |
Linear Unit |
|
Number of Permutations (Optional) |
Specifies the number of permutations that will be used to create reference distributions when calculating global and local p-values. All p-values are calculated using two-sided hypothesis tests.
|
Long |
Derived output
| Label | Explanation | Data type |
|---|---|---|
|
Lee's L |
The Lee's L statistic for the analysis variables. |
Double |
|
P-value |
The p-value for the Lee's L statistic. |
Double |
|
Pearson Correlation |
The Pearson correlation between the analysis variables. |
Double |
Environments
Geographic Transformations, Output Coordinate System, Parallel Processing Factor, Random number generator
Licensing information
- Basic: Yes
- Standard: Yes
- Advanced: Yes