Evaluate Variable Influence for Predictions (Spatial Statistics Tools)
Summary
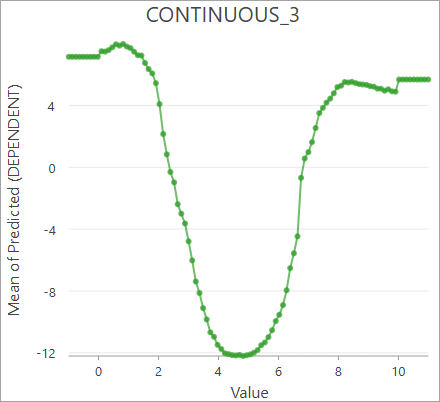
Evaluates how variables influence predictions from a spatial statistics model (.ssm) file. The tool creates partial dependence plots allowing you to see how each explanatory variable influenced predictions from the input model.
Learn more about how Evaluate Variable Influence for Predictions works
Illustration
Usage
The input model file must be created using the Forest-based and Boosted Classification and Regression tool.
You must provide input features that contain the same explanatory variables that were used to train the input model file, along with matching explanatory variable fields, distance features, and explanatory rasters. The tool creates an output table containing charts of the partial dependence plots for each explanatory variable when predicting to the input features. These charts display how each explanatory variable influenced the predicted values on average, along with the shape of the relationship.
When the dependent variable is categorical (a classification model), the partial dependence plots will show the average probability of classifying the first category. You can change the category displayed by the chart in the Chart Properties pane. In the Data tab, press the Select button under Numeric field(s), and choose the category to display. Only turn on one category at a time for the chart to correctly display the partial dependence plot.
The geoprocessing messages display various information about the input model file, including model parameters and training statistics. The contents of the messages depend on how the model was created.
Parameters
| Label | Explanation | Data type |
|---|---|---|
|
Input Model File |
The spatial statistics model file that will be used to make predictions and generate partial dependence plots. The model file must be created using the Forest-based and Boosted Classification and Regression tool. |
File |
|
Evaluation Type |
Specifies the method that will be used to evaluate variable influence. Only partial dependence plots are currently supported.
|
String |
|
Input Features |
The input features from which predictions will be evaluated. The input features must contain matching fields to the features that were used to create the input model file. |
Feature Layer |
|
Output Features (Optional) |
The output features. This parameter is not currently used. |
Feature Class |
|
Output Table (Optional) |
The output table containing the partial dependence plot values. The table includes charts that display the partial dependence plots of each explanatory variable. |
Table |
|
Match Explanatory Variables (Optional) |
A list of the explanatory variables of the input model and corresponding fields of the input features. For each explanatory variable in the Value table columns:
|
Value Table |
|
Match Distance Features (Optional) |
A list of the explanatory distance features of the input model and corresponding prediction distance features. For each explanatory distance features in the Value table columns:
|
Value Table |
|
Match Explanatory Rasters (Optional) |
A list of the explanatory rasters of the input model and corresponding prediction rasters. For each explanatory raster in the Value table columns:
|
Value Table |
Environments
This tool does not use any geoprocessing environments.
Licensing information
- Basic: Limited
Spatial Analyst is required to use rasters. - Standard: Limited
Spatial Analyst is required to use rasters. - Advanced: Limited
Spatial Analyst is required to use rasters.