Forest-based and Boosted Classification and Regression (Spatial Statistics Tools)
Summary
Creates models and generates predictions using one of two supervised machine learning methods: an adaptation of the random forest algorithm developed by Leo Breiman and Adele Cutler or the Extreme Gradient Boosting (XGBoost) algorithm developed by Tianqi Chen and Carlos Guestrin. Predictions can be performed for both categorical variables (classification) and continuous variables (regression). Explanatory variables can take the form of fields in the attribute table of the training features, raster datasets, and distance features used to calculate proximity values for use as additional variables. In addition to validation of model performance based on the training data, predictions can be made to either features or a prediction raster.
Learn more about how Forest-based and Boosted Classification and Regression works
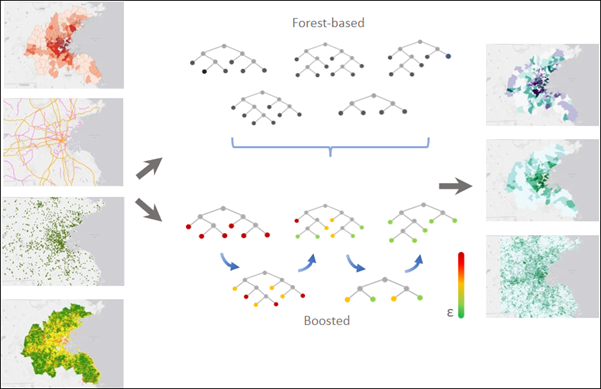
Illustration
Usage
This tool supports two model types: forest-based and gradient boosted. Both model types use hundreds of trees, called an ensemble of decision trees, to create a model that can be used for prediction.
Forest-based—Creates a model by applying a bagging technique in which each decision tree is created in parallel using a randomly generated portion of the original (training) data. Each tree generates its own prediction and votes on an outcome. The forest-based model considers the votes from all the decision trees to predict or classify the outcome of an unknown sample. This is important, as individual trees may have issues with overfitting a model; however, combining multiple trees in a forest for prediction addresses the overfitting problem associated with a single tree. This model requires fewer parameters and is more intuitive.
Gradient Boosted—Creates a model by applying a boosting technique in which each decision tree is created sequentially using the original (training) data. Each subsequent tree corrects the errors of the previous trees, so the model combines several weak learners to become a strong prediction model. The gradient boosted model incorporates regularization and an early stopping technique which can prevent overfitting. This model provides greater control over the hyperparameters and is more complex.
This tool can be used in three operation modes: train, predict to features, and predict to raster. In the Prediction Type parameter, the Train only option can be used to evaluate the performance of various models as you explore different explanatory variables and tool settings. Once you find a good model, use the Predict to features or Predict to raster option.
This is a data-driven tool and performs best on large datasets. The tool should be trained on at least several hundred features for best results. It is not an appropriate tool for very small datasets.
The Input Training Features parameter value can be points or polygons. This tool does not work with multipart data.
An ArcGIS Spatial Analyst extension license is required to use rasters as explanatory variables or to predict to an Output Prediction Surface value.
This tool produces the following optional outputs:
Output Trained Features—A feature class that contains all the Input Training Features values and all the explanatory variables used in the model. The explanatory variables include all the input fields used, distances calculated, and raster values extracted or calculated. The feature class will also include predictions for every feature in the Input Training Features values. This includes the features that were used to train and validate the model. If the variable to predict is not categorical, the feature class will include the residual and the standard residual for each prediction. If the variable to predict is categorical, the feature class will contain a
Correctly Classifiedfield that specifies whether the model correctly classified each prediction. Use theResidualandStandard Residualfields orCorrectly Classifiedfield to help assess the performance of the model created.Output Trained Model File—A reusable file that contains the trained model results. The file can be used in the Predict Using Spatial Statistics Model File tool to predict to new features.
Output Predicted Features—A feature class that contains the model's predicted value for each feature. This option is only available when the Prediction Type parameter value is Predict to features.
Output Prediction Surface—An output raster that contains the prediction results. This output is only available when the Prediction Type parameter value is Predict to raster.
Output Variable Importance Table—A table that describes the importance of each explanatory variable (fields, distance features, and rasters).
Output Parameter Tuning Table—A table that contains the parameter settings and objective values for each optimization trial. This output is only available when the Optimize Parameters parameter is checked.
Output Classification Performance Table (Confusion Matrix)—A table that summarizes the performance of the model on the validation data. The columns of the matrix represent the categories predicted by the model, and the rows represent the actual categories. Use the table to evaluate how the model performs on the validation data. This output is only available when the Treat as Categorical parameter is checked.
This tool creates messages to help you understand the performance of the model created. You can access the messages by hovering over the progress bar, clicking the pop-out button, or expanding the messages section in the Geoprocessing pane. You can also access the messages for a previous run of this tool through the Geoprocessing history. The messages include the following:
Information on the model characteristics
Model out of bag errors
Training diagnostics
Validation diagnostics
Explanatory variable diagnostics
Variable Importance—If the Output Variable Importance Table parameter value is provided, the geoprocessing messages will report the 20 variables with the highest importance. If the Number of Runs for Validation parameter value is greater than 1, there will be more than one set of variable importance values. Each run will have a set of variable importance values so the geoprocessing messages will report the set of variable importance values associated with the run with an R-Squared or accuracy that is closest to the median R-Squared or accuracy.
This tool adds the following optional charts to the Contents pane:
Prediction Performance—A stacked bar chart to help evaluate how well the model fits the data. The categories on the x-axis were predicted by the model for the Input Training Features value. This includes the features that were used to train and validate the model. The colors represent the true categories of the input training features. This chart is only produced if the variable to predict is categorical, the Treat Variable as Categorical checkbox is checked, and the Output Trained Features parameter is provided.
Confusion Matrix—A matrix heat chart. The x-axis represents the predicted category of the features in the Input Training Features value and the y-axis represents their actual category. The diagonal cells visualize the number of times the model correctly predicted a category. Higher counts in the diagonal cells indicate that the model performed well. This chart is only produced if the variable to predict is categorical and the Treat Variable as Categorical parameter is checked.
Summary of Variable Importance or Distribution of Variable Importance—A bar chart that displays the importance of each explanatory variable to the model. If the Number of Runs for Validation value is greater than 1, the chart will be a box plot that displays the distribution of importance values for each explanatory variable. This chart is produced if you provide the Output Variable Importance Table parameter value.
Validation Performance—A stacked bar chart to help evaluate how well the model performs on the validation data. The actual categories of the features in the validation data are on the x-axis. The color represents the predicted category of the features in the validation data. This chart is only produced if the variable to predict is categorical, the Treat Variable as Categorical checkbox is checked, and the Output Classification Performance Table (Confusion Matrix) parameter value is provided.
Validation R2 or Validation Accuracy—A histogram that displays the distribution of R2 or accuracy values. The distribution of R2 or accuracy values is due to randomness that is introduced when creating the model. This chart helps to evaluate the stability of the model performance across different model runs. This chart is only generated when the Output Validation Table parameter value is provided and the Number of Runs for Validation value is greater than 1.
Explanatory variables can come from fields or be calculated from distance features or extracted from rasters. You can use any combination of these explanatory variable types, but at least one type is required. The explanatory variables (from fields, distance features, or rasters) used should contain a variety of values. If the explanatory variable is categorical, check the Categorical check box. The Categorical check box will automatically be checked for variables of type string. Categorical explanatory variables are limited to 60 unique values, though a smaller number of categories will improve model performance. For a given data size, the more categories a variable contains, the more likely it is to dominate the model and lead to less effective prediction results.
Distance features are used to automatically create explanatory variables representing a distance from the provided features to the Input Training Features values. Distances will be calculated from each feature of the Input Training Feature value to the nearest Explanatory Training Distance Features value. If the input Explanatory Training Distance Features values are polygons or lines, the distance attributes will be calculated as the distance between the closest segments of the pair of features. However, distances are calculated differently for polygons and lines. See How proximity tools calculate distance for details.
If the Input Training Features values are points and you are using the Explanatory Training Rasters parameter, the tool drills down to extract explanatory variables at each point location. For multiband rasters, only the first band is used.
Although you can have multiple layers with the same name in the Contents pane, the tool does not accept explanatory distance and explanatory raster layers with the same name. To avoid this issue, ensure that each layer has a unique name or remove duplicate layer names in the drop-down lists.
If the Input Training Features values are polygons, the Variable to Predict parameter value is categorical, and you are using Explanatory Training Rasters values exclusively, the Convert Polygons to Raster Resolution for Training parameter will be available. If you check this parameter, the polygon will be divided into points at the centroid of each raster cell whose centroid falls within the polygon. The raster values at each point location are then extracted and used to train the model. A bilinear sampling method is used for numeric variables, and the nearest method is used for categorical variables. The default cell size of the converted polygons will be the maximum cell size of input rasters. However, you can change this using the Cell Size environment setting. If this parameter is not checked, one raster value for each polygon will be used in the model. Each polygon is assigned the average value for continuous rasters and the majority for categorical rasters.
There must be variation in the data used for each explanatory variable specified. If you receive an error that there is no variation in one of the fields or rasters specified, you can try running the tool again, marking that variable as categorical. If 95 percent of the features have the same value for a particular variable, that variable is flagged as having no variation.
The Compensate for Sparse Categories parameter can be used if the variation in the categories is unbalanced. For example, if you have some categories that occur hundreds of times in the dataset and a few that occur significantly less often, checking this parameter will ensure that each category is represented in each tree to create balanced models. This parameter is only supported when the Model Type parameter value is Forest-based.
When matching explanatory variables, the
PredictionandTrainingfields must be of the same type (a double field inTrainingmust be matched to a double field inPrediction).Forest-based and boosted models do not extrapolate, they only classify or predict to a value that the model was trained on. When predicting a value based on explanatory variables that are much higher or lower than the range of the original training dataset, the model will estimate the value to be around the highest or lowest value in the original dataset. This tool may perform poorly when trying to predict with explanatory variables that are out of range of the explanatory variables used to train the model.
The tool will fail if categories exist in the prediction explanatory variables that are not present in the training features. Similarly, the tool will fail if categories exist in the validation data that are not present in the training features.
To use mosaic datasets as explanatory variables, run the Make Mosaic Layer tool first and copy the full path to the layer into the tool or use the Make Mosaic Layer tool and the Make Raster Layer tool to adjust the processing template for the mosaic dataset.
The default value for the Number of Trees parameter is 100. For the Forest-based model, increasing the number of trees in the model will result in more accurate model prediction, but the model will take longer to calculate.
If the Model Type parameter value is Forest-based and the Calculate Uncertainty parameter is checked, the tool will calculate a 90 percent prediction interval around each predicted value of the Variable to Predict value. When the Prediction Type parameter value is Train only or Predict to features, two fields will be added to either the Output Trained Features value or the Output Predicted Features value. These fields, ending with
_P05and_P95, represent the upper and lower bounds of the prediction interval. For any new observation, you can predict with 90 percent confidence that the value of a new observation will fall within the interval, given the same explanatory variables. When the Prediction Type parameter value is Predict to raster, two additional rasters representing the upper and lower bounds of the prediction interval will be added to the Contents pane.For performance reasons, the Explanatory Training Distance Features parameter is not available when the Prediction Type parameter value is Predict to raster. To include distances to features as explanatory variables, calculate distance rasters using the Distance Accumulation tool, and include the distance rasters in the Explanatory Training Rasters parameter.
This tool supports parallel processing for prediction and uses 50 percent of available processors by default. The number of processors can be increased or decreased using the Parallel Processing Factor environment.
To learn more about how this tool works and understand the output messages and charts, see How Forest-based Classification and Regression works.
References:
Breiman, Leo. Out-Of-Bag Estimation. 1996.
Breiman, L. (1996). Bagging predictors. Machine learning, 24(2), 123-140.
Breiman, Leo. "Random Forests". Machine Learning. 45 (1): 5-32. doi:10.1023/A:1010933404324. 2001.
Breiman, L., J.H. Friedman, R.A. Olshen, C.J. Stone. Classification and regression trees. New York: Routledge. Chapter 4. 2017.
Chen, T., and Guestrin, C. (2016). "XGBoost: A Scalable Tree Boosting System." In Proceedings of the 22nd ACM SIGKDD Conference on Knowledge Discovery and Data Mining. 785-794.**
Dietterich, T. G. (2000, June). Ensemble methods in machine learning. In International workshop on multiple classifier systems (pp. 1-15). Springer, Berlin, Heidelberg.
Gini, C. (1912). Variabilità e mutabilità. Reprinted in Memorie di metodologica statistica (Ed. Pizetti E, Salvemini, T). Rome: Libreria Eredi Virgilio Veschi.
Grömping, U. (2009). Variable importance assessment in regression: linear regression versus random forest. The American Statistician, 63(4), 308-319.
Ho, T. K. (1995, August). Random decision forests. In Document analysis and recognition, 1995., proceedings of the third international conference on Document Analysis and Recognition. (Vol. 1, pp. 278-282). IEEE.
James, G., Witten, D., Hastie, T., & Tibshirani, R. (2013).* An introduction to statistical learning* (Vol. 112). New York: springer.
LeBlanc, M., & Tibshirani, R. (1996). Combining estimates in regression and classification. Journal of the American Statistical Association, 91(436), 1641-1650.
Loh, W. Y., & Shih, Y. S. (1997). Split selection methods for classification trees. Statistica sinica, 815-840.
Meinshausen, Nicolai. "Quantile regression forests." Journal of Machine Learning Research 7. Jun (2006): 983-999.
Nadeau, C., & Bengio, Y. (2000). Inference for the generalization error. In Advances in neural information processing systems (pp. 307-313).
Strobl, C., Boulesteix, A. L., Kneib, T., Augustin, T., & Zeileis, A. (2008). Conditional variable importance for random forests. BMC bioinformatics, 9(1), 307.
Zhou, Z. H. (2012). Ensemble methods: foundations and algorithms. CRC press.
Parameters
| Label | Explanation | Data type |
|---|---|---|
|
Prediction Type |
Specifies the operation mode that will be used. The tool can be run to train a model to only assess performance, predict features, or create a prediction surface.
|
String |
|
Input Training Features |
The feature class containing the Variable to Predict parameter value and, optionally, the explanatory training variables from fields. |
Feature Layer |
|
Variable to Predict |
The variable from the Input Training Features parameter value containing the values to be used to train the model. This field contains known (training) values of the variable that will be used to predict at unknown locations. |
Field |
|
Treat Variable as Categorical (Optional) |
Specifies whether the Variable to Predict value is a categorical variable.
|
Boolean |
|
Explanatory Training Variables (Optional) |
A list of fields representing the explanatory variables that help predict the value or category of the Variable to Predict value. Check the Categorical check box for any variables that represent classes or categories (such as land cover or presence or absence). Value table columns:
|
Value Table |
|
Explanatory Training Distance Features (Optional) |
The feature layer containing the explanatory training distance features. Explanatory variables will be automatically created by calculating a distance from the provided features to the Input Training Features values. Distances will be calculated from each of the features in the Input Training Features value to the nearest Explanatory Training Distance Features values. If the input Explanatory Training Distance Features values are polygons or lines, the distance attributes will be calculated as the distance between the closest segments of the pair of features. |
Feature Layer |
|
Explanatory Training Rasters (Optional) |
The explanatory training variables extracted from rasters. Explanatory training variables will be automatically created by extracting raster cell values. For each feature in the Input Training Features parameter, the value of the raster cell is extracted at that exact location. Bilinear raster resampling is used when extracting the raster value for continuous rasters. Nearest neighbor assignment is used when extracting a raster value from categorical rasters. Check the Categorical check box for any rasters that represent classes or categories such as land cover or presence or absence. Value table columns:
|
Value Table |
|
Input Prediction Features (Optional) |
A feature class representing the locations where predictions will be made. This feature class must also contain any explanatory variables provided as fields that correspond to those used from the training data. |
Feature Layer |
|
Output Predicted Features (Optional) |
The output feature class containing the prediction results. |
Feature Class |
|
Output Prediction Surface (Optional) |
The output raster containing the prediction results. The default cell size will be the maximum cell size of the raster inputs. To set a different cell size, use the Cell Size environment setting. |
Raster Dataset |
|
Match Explanatory Variables (Optional) |
A list of the Explanatory Variables values specified from the Input Training Features parameter on the right and corresponding fields from the Input Prediction Features parameter on the left. Value table columns:
|
Value Table |
|
Match Distance Features (Optional) |
A list of the Explanatory Distance Features values specified for the Input Training Features parameter on the right and corresponding feature sets from the Input Prediction Features parameter on the left. Explanatory Distance Features values that are more appropriate for the Input Prediction Features parameter can be provided if those used for training are in a different study area or time period. Value table columns:
|
Value Table |
|
Match Explanatory Rasters (Optional) |
A list of the Explanatory Rasters values specified for the Input Training Features parameter on the right and corresponding rasters from the Input Prediction Features parameter or the Prediction Surface parameter to be created on the left. The Explanatory Rasters values that are more appropriate for the Input Prediction Features parameter can be provided if those used for training are in a different study area or time period. Value table columns:
|
Value Table |
|
Output Trained Features (Optional) |
The explanatory variables used for training (including sampled raster values and distance calculations), as well as the observed Variable to Predict field and accompanying predictions that will be used to further assess performance of the trained model. |
Feature Class |
|
Output Variable Importance Table (Optional) |
The table that will contain information describing the importance of each explanatory variable used in the model. The explanatory variables include fields, distance features, and rasters used to create the model. If the Model type parameter value is Gradient Boosted, importance is measured by gain, weight, and cover, and the table will include these fields. The output will include a bar chart, if the Number of Runs for Validation parameter value is one, or a box plot, if the value is greater than one, of the importance of the explanatory variables. |
Table |
|
Convert Polygons to Raster Resolution for Training (Optional) |
Specifies how polygons will be treated when training the model if the Input Features values are polygons with a categorical Variable to Predict value and only Explanatory Rasters values have been provided.
|
Boolean |
|
Number of Trees (Optional) |
The number of trees that will be created in the Forest-based and Gradient Boosted models. The default is 100. If the Model Type parameter value is Forest-based, more trees will generally result in more accurate model predictions; however, the model will take longer to calculate. If the Model Type parameter value is Gradient Boosted, more trees may result in more accurate model predictions; however, they may also lead to overfitting the training data. To avoid overfitting the data, provide values for the Maximum Tree Depth, L2 Regularization (Lambda), Minimum Loss Reduction for Splits (Gamma), and Learning Rate (Eta) parameters. |
Long |
|
Minimum Leaf Size (Optional) |
The minimum number of observations required to keep a leaf (that is, the terminal node on a tree without further splits). The default minimum for regression is 5 and the default for classification is 1. For very large data, increasing these numbers will decrease the run time of the tool. |
Long |
|
Maximum Tree Depth (Optional) |
The maximum number of splits that will be made down a tree. Using a large maximum depth, more splits will be created, which may increase the chances of overfitting the model. If the Model type parameter value is Forest-based, the default is data driven and depends on the number of trees created and the number of variables included. If the Model type parameter value is Gradient Boosted, the default is 6. |
Long |
|
Data Available per Tree (%) (Optional) |
The percentage of the Input Training Features values that will be used for each decision tree. The default is 100 percent of the data. Samples for each tree are taken randomly from two-thirds of the data specified. Each decision tree in the forest is created using a random sample or subset (approximately two-thirds) of the training data available. Using a lower percentage of the input data for each decision tree decreases the run time of the tool for very large datasets. |
Long |
|
Number of Randomly Sampled Variables (Optional) |
The number of explanatory variables that will be used to create each decision tree. Each decision tree in the forest-based and gradient boosted models is created using a random subset of the specified explanatory variables. Increasing the number of variables used in each decision tree will increase the chances of overfitting the model, particularly if there is one or more dominant variables. The default is to use the square root of the total number of explanatory variables (fields, distances, and rasters combined) if the Variable to Predict value is categorical or to divide the total number of explanatory variables (fields, distances, and rasters combined) by 3 if the Variable to Predict value is numeric. |
Long |
|
Training Data Excluded for Validation (%) (Optional) |
The percentage (between 0 percent and 50 percent) of the Input Training Features values that will be reserved as the test dataset for validation. The model will be trained without this random subset of data, and the model predicted values for those features will be compared to the observed values. The default is 10 percent. |
Double |
|
Output Classification Performance Table (Confusion Matrix) (Optional) |
A confusion matrix that summarizes the performance of the model created on the validation data. The matrix compares the model predicted categories for the validation data to the actual categories. This table can be used to calculate additional diagnostics that are not included in the output messages. This parameter is available when the Variable to Predict value is categorical and the Treat as Categorical parameter is checked. |
Table |
|
Output Validation Table (Optional) |
A table that contains the R2 for each model if the Variable to Predict value is not categorical, or the accuracy of each model if the value is categorical. This table includes a bar chart of the distribution of accuracies or the R2 values. This distribution can be used to assess the stability of the model. This parameter is available when the Number of Runs for Validation value is greater than 2. |
Table |
|
Compensate for Sparse Categories (Optional) |
Specifies whether each category in the training dataset, regardless of its frequency, will be represented in each tree. This parameter is available when the Model Type parameter value is Forest-based.
|
Boolean |
|
Number of Runs for Validation (Optional) |
The number of iterations of the tool. The distribution of R-squared values (continuous) or accuracies (categorical) of all the models can be displayed using the Output Validation Table parameter. If the Prediction Type parameter value is Predict to raster or Predict to features, the model that produced the median R-squared value or accuracy will be used to make predictions. Using the median value helps ensure stability of the predictions. |
Long |
|
Calculate Uncertainty (Optional) |
Specifies whether prediction uncertainty will be calculated when training, predicting to features, or predicting to raster. This parameter is available when the Model Type parameter value is Forest-based.
|
Boolean |
|
Output Trained Model File (Optional) |
An output model file that will save the trained model, which can be used later for prediction. |
File |
|
Model Type (Optional) |
Specifies the method that will be used to create the model.
|
String |
|
L2 Regularization (Lambda) (Optional) |
A regularization term that reduces the model's sensitivity to individual features. Increasing this value will make the model more conservative and prevent overfitting the training data. If the value is 0, the model becomes the traditional Gradient Boosting model. The default is 1. This parameter is available when the Model Type parameter value is Gradient Boosted. |
Double |
|
Minimum Loss Reduction for Splits (Gamma) (Optional) |
A threshold for the minimum loss reduction needed to split trees. Potential splits are evaluated for their loss reduction. If the candidate split has a higher loss reduction than this threshold value, the partition will occur. Higher threshold values avoid overfitting and result in more conservative models with fewer partitions. The default is 0. This parameter is available when the Model Type parameter value is Gradient Boosted. |
Double |
|
Learning Rate (Eta) (Optional) |
A value that reduces the contribution of each tree to the final prediction. The value should be greater than 0 and less than or equal to 1. A lower learning rate prevents overfitting the model; however, it may require longer computation times. The default is 0.3. This parameter is available when the Model Type parameter value is Gradient Boosted. |
Double |
|
Maximum Number of Bins for Searching Splits (Optional) |
The number of bins that the training data will be divided into to search for the best splitting point. The value cannot be 1. The default is 0, which corresponds to the use of a greedy algorithm. A greedy algorithm will create a candidate split at every data point. Providing too few bins for searching is not recommended because it will lead to poor model prediction performance. This parameter is available when the Model Type parameter value is Gradient Boosted. |
Long |
|
Optimize Parameters (Optional) |
Specifies whether an optimization method will be used to find the set of hyperparameters that achieve optimal model performance.
|
Boolean |
|
Optimization Method (Optional) |
Specifies the optimization method that will be used to select and test search points to find the optimal set of hyperparameters. Search points are combinations of hyperparameters within the search space specified by the Model Parameter Setting parameter. This option is available when the Optimization Parameters parameter is checked.
|
String |
|
Optimize Target (Objective) (Optional) |
Specifies the objective function or value that will be minimized or maximized to find the optimal set of hyperparameters.
|
String |
|
Number of Runs for Parameter Sets (Optional) |
The number of search points within the search space specified by the Model Parameter Setting parameter that will be tested. This parameter is available when the Optimization Method value is Random Search (Quick) or Random Search (Robust). |
Long |
|
Model Parameter Setting (Optional) |
A list of hyperparameters and their search spaces. Customize the search space of each hyperparameter by providing a lower bound, upper bound, and interval. The lower bound and upper bound specify the range of possible values for the hyperparameter. Value table columns:
|
Value Table |
|
Output Parameter Tuning Table (Optional) |
A table that contains the parameter settings and objective values for each optimization trial. The output includes a chart of all the trials and their objective values. This option is available when Optimize Parameters is checked. |
Table |
|
Include All Prediction Probabilities (Optional) |
For categorical variables to predict, specifies whether the probability of every category of the categorical variable or only the probability of the record's category will be predicted. For example, if a categorical variable has categories A, B, and C, and the first record has category B, use this parameter to specify whether the probability for categories A, B, and C will be predicted or only the probability of category B will be predicted.
|
Boolean |
Derived output
| Label | Explanation | Data type |
|---|---|---|
|
Output Uncertainty Raster Layers |
When the Calculate Uncertainty parameter is checked, the tool will calculate a 90 percent prediction interval around each predicted value of the Variable to Predict parameter. |
Raster Layer |
Environments
Cell Size, Output Coordinate System, Random number generator, Mask, Parallel Processing Factor
Special cases
- Random number generator
-
The Random Generator Type used is always Mersenne Twister.
- Parallel Processing Factor
-
Parallel processing is only used when predictions are being made.
Licensing information
- Basic: Limited
Spatial Analyst is required to use rasters. - Standard: Limited
Spatial Analyst is required to use rasters. - Advanced: Limited
Spatial Analyst is required to use rasters.