Design a real-time analytic
This lesson builds on the create a feed lesson in which you created a new feed to collect Automatic Identification System (AIS) ship data.
In this lesson, you will create a real-time analytic that will enrich the streaming AIS data with the U.S. Coast Guard district where each ship is located. This lesson covers adding and configuring real-time tools, adding outputs that disseminate data, and storing features in a hosted feature layer.
This lesson is designed for beginners. You must connect to an ArcGIS organization with access to ArcGIS Velocity. The estimated time to complete this lesson is 30 minutes.
Create a new real-time analytic
Once you have created a feed, you can explore and create a real-time analytic by completing the following steps:
Open the Velocity app.
From the main menu, click the Real-Time tab and explore the Real-Time Analytics page.
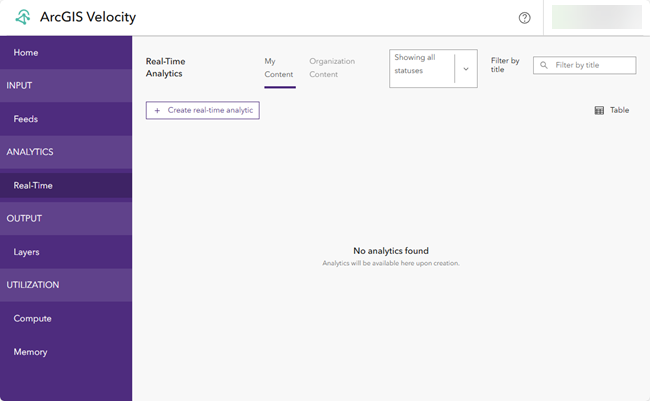
The Real-Time Analytics page displays the list and status of your real-time analytics. A real-time analytic processes data collected through a feed and analyzes each individual event record as it is received. Real-time analytics are used for transforming data, geofencing, and incident detection.
Click Create real-time analytic.
The options to choose an existing feed or create a new one appear.
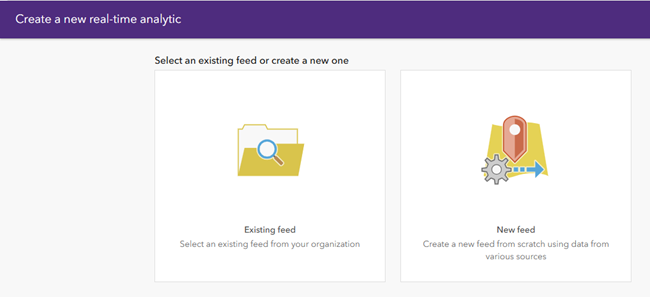
Click the Existing feed option to choose an existing feed from your organization.
On the Select existing feed dialog box, click the My Content drop-down arrow and choose My Organization.
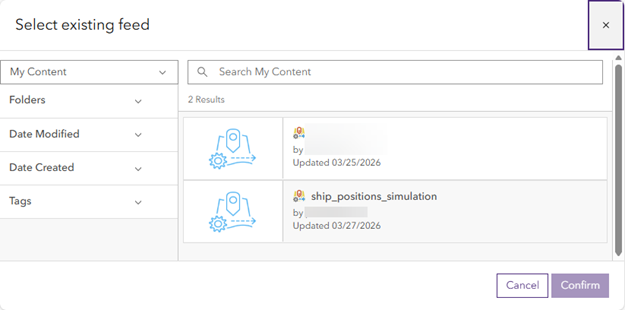
On the Select existing feed dialog box, choose the ship_positions_simulation feed.
Click Confirm to choose an existing feed.
Note:
The ship_positions_simulation feed is available if you completed the create a feed lesson. If it is not available, complete that lesson before continuing.
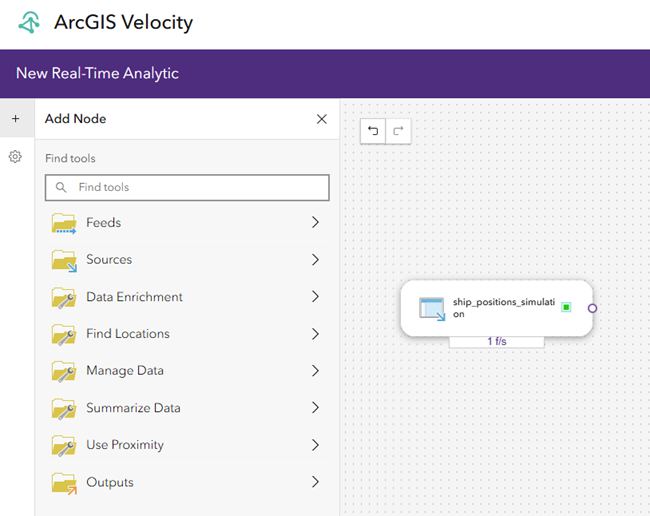
The real-time analytic editor appears, where you can configure additional feeds, sources, analytic tools and outputs to configure a step-by-step real-time processing workflow. By default, the editor shows the chosen feed and all processing elements in a linear, sequential layout.
Create the analytic
Although the analytic only contains the input feed at this point, you create it so you can return to it later if necessary.
On the New Real-Time Analytic page, click Create analytic.
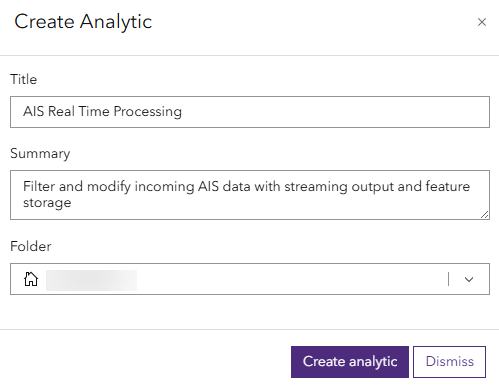
The Create Analytic dialog box appears.
Set the Title and Summary parameters as follows:
For Title, type AIS Real Time Processing.
For Summary, type Filter and modify incoming AIS data with streaming output and feature storage.
For Folder, choose the folder where you want to save the new analytic.
Click Create analytic to create the analytic.
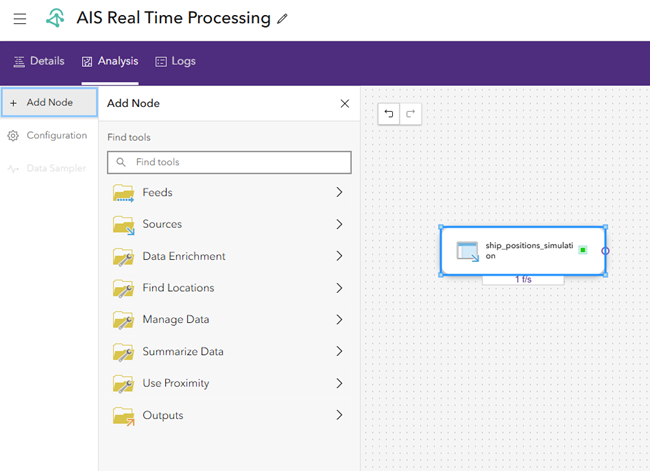
The analytic editor appears, where you can add new elements including feeds, sources, analytic tools, and outputs.
Add and configure an analytic tool
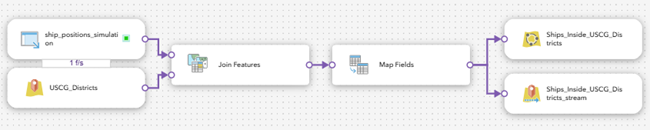
Next, add a tool to the AIS Real Time Processing analytic to perform real-time analysis on the AIS data feed. With Velocity, you can build a sequence of successive analytic nodes that define the flow of data from inputs to outputs.
Use the Join Features tool to enrich the inbound AIS data with the name of the U.S. Coast Guard district where each ship is located. The tool performs a spatial join between the ship point features and the U.S. Coast Guard District polygon layer.
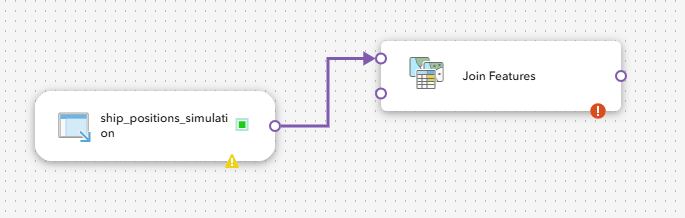
Add the Join Features tool to the AIS Real Time Processing analytic and connect it to the ship_positions_simulation feed.
From the Add Node menu, click Summarize Data.
Drag the Join Features tool node next to the ship_positions_simulation feed node.
Connect the ship_positions_simulation feed node to the Join Features tool node.
Click Sources, choose Feature Layer and configure the feature layer source as follows:
Click the My Content drop-down menu and choose By URL.
In the Layer URL text box, type
https://services2.arcgis.com/FiaPA4ga0iQKduv3/arcgis/rest/services/US_Coast_Guard_Districts_new/FeatureServer.Choose the USCG_Districts (0) sublayer and click Next.
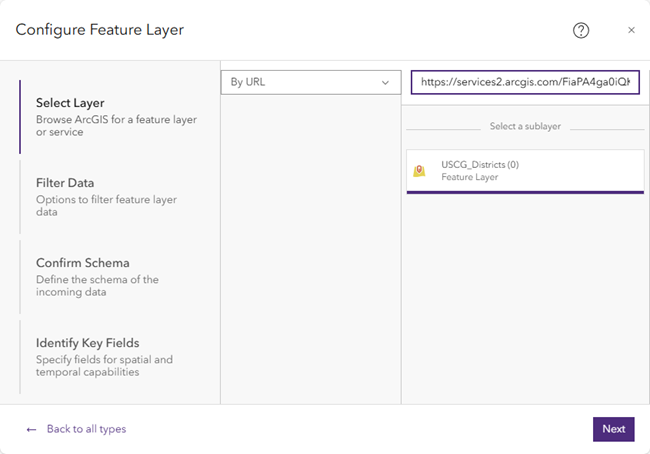
For Filter Data, set the Output spatial reference (optional) parameter to GCS WGS 1984 and click Next.
For Confirm Schema, accept the schema as sampled and click Next.
Velocity samples the data and generates a schema to start with.
For Identify Key Fields, under Tracking, choose Data does not have a Track ID.
This step of the configuration wizard is used to define the construction of geometry, date and time, and tracking information. Since the data source is an ArcGIS feature layer, the geometry and date and time information is automatically configured.
Click Complete to create and add the data source to the editor.
Drag the USCG_Districts source node below the ship_positions_simulation feed node and connect it to the Join Features tool node.
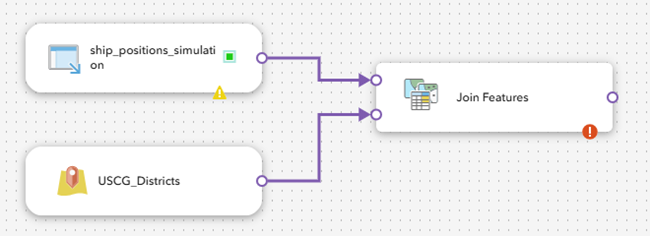
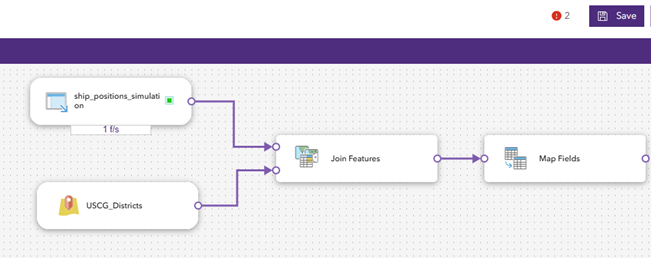
The U.S. Coast Guard District feature layer is added as the enrichment data source to the Join Features tool. The Join Features tool now has two inputs connected to it: the ship positions feed and the U.S. Coast Guard District feature layer data source.
Double-click the Join Features tool to open its properties and configure the tool as follows:
For Join operation, click One-to-one.
For Retain all features, click Only retain features that are joined.
For Relationship, check the Spatial check box and choose Intersects from the drop-down menu for the spatial relationship type.
Set the Summary fields parameters.
For Attribute, choose DistrictName.
For Statistic, choose Any.
The default is Any.
For Output field name, delete DistrictName_Any and type DistrictName.
Click Update summary fields to save the properties.
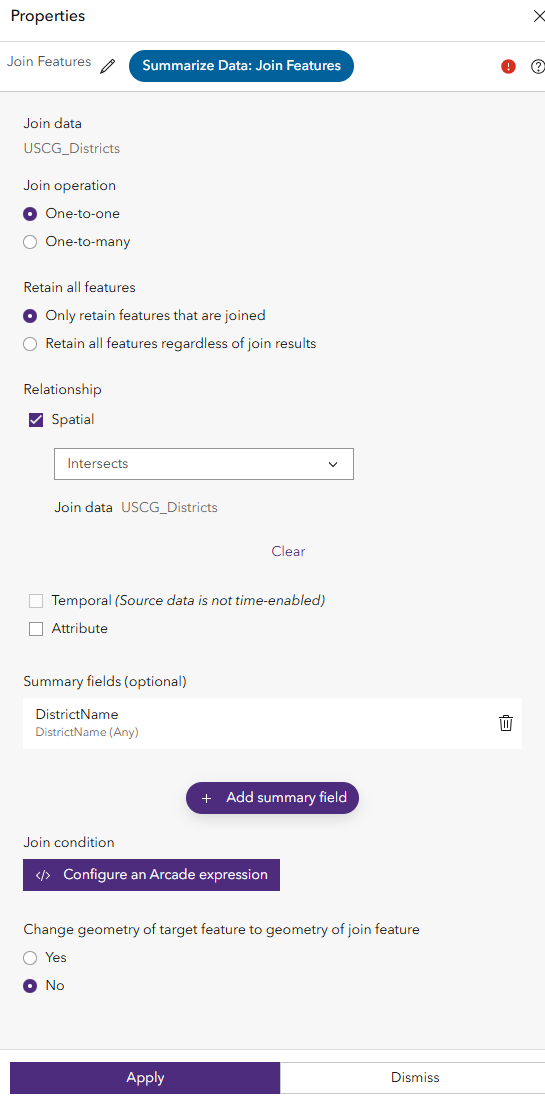
Leave Change geometry of target feature to geometry of join feature set to No.
Click Apply to save the properties.
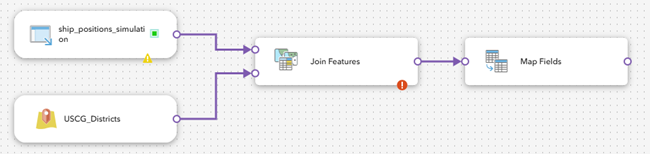
Use the Map Fields tool to transform data from an input schema to an output schema. You can perform field calculations, create fields, and tag key fields with the Map Fields tool.
Add the Map Fields tool to the AIS Real Time Processing analytic and connect it to the Join Features tool.
From the Add Note menu, click Manage Data.
Bring the Select Fields tool node next to the Join Features tool node.
Connect the Join Features tool node to the Map Fields tool node.
Double-click the Map fields tool to open its properties and configure the tool as follows:
Select the BaseDateTime field and change the output field name to vessel_time. Click Update mapping to apply the change.
Select the VesselName field and change the output field name to vessel_name. Click Update mapping to apply the change.
Click on the delete icon to remove the following fields: LAT, LON, SOG, COG, Heading, IMO, CallSign, VesselType, Status, Length, Width, Draft, Cargo, and COUNT.
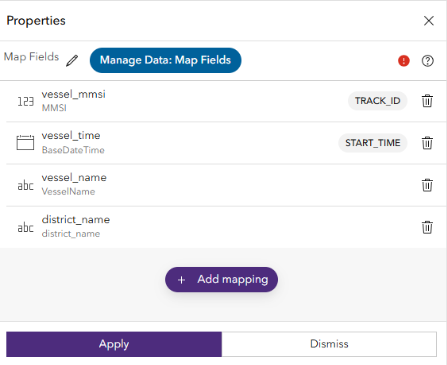
Select Apply to save the properties.
In the analytic editor, click Save to save the AIS Real Time Processing analytic.
This lesson demonstrates how to detect ships that intersect a U.S. Coast Guard district, and how to add, or join, that contextual information to the ship data. This can be used for increased situational awareness or further analysis.
Configure a feature layer output
With the data source and analytic tools created, you can add two outputs to store and visualize the data. First, add and configure an output to store the data in a new feature layer. Then, add another output to send the data to a stream layer for visualization in a web map.
Note:
The hosted feature layer name must be unique within an organization.
The feature layer (new) outputs can be created using the ArcGIS spatiotemporal big data store, or the ArcGIS relational data store configured with your hosting server. The Enterprise hosting server is included with your base Enterprise deployment and uses a relational ArcGIS data store to manage hosted data. To store an output as a spatiotemporal feature layer, your Enterprise environment must include an ArcGIS data store configured as a spatiotemporal big data store.
To add an output, complete the following steps:
Turn off Store data in spatiotemporal feature layer.
For Data storage method, choose Keep only latest feature for each Track ID value.
This retains only the latest observation for each track, in this case each ship. Subsequent observations overwrite any previous observations for each track in the output feature layer.
Note:
The Add all new features option retains all incoming data rather than only the most recently received features.
For Each time the analytic starts, choose Replace existing features and schema.
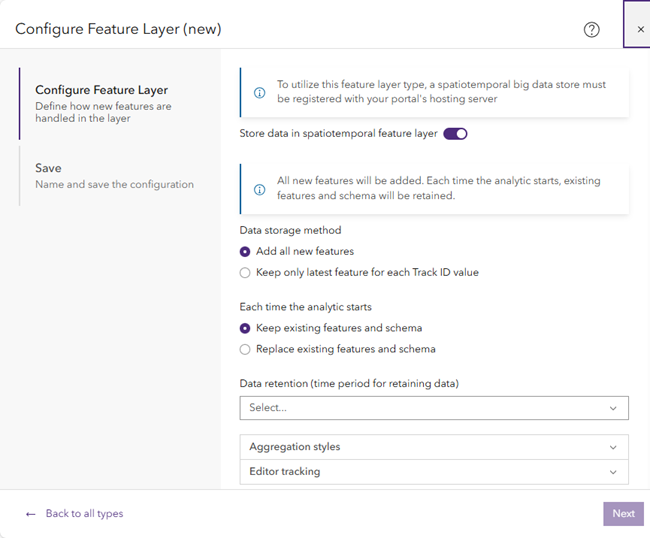
Each time the analytic starts, all records in the output feature layer are deleted and the schema of the output feature layer is regenerated. This is useful for developing and testing a real-time analytic and adding, removing, or changing tools between analytic runs.
Note:
Choose the Keep existing features and schema option to retain the existing data when the real-time analytic restarts.
Click Next.
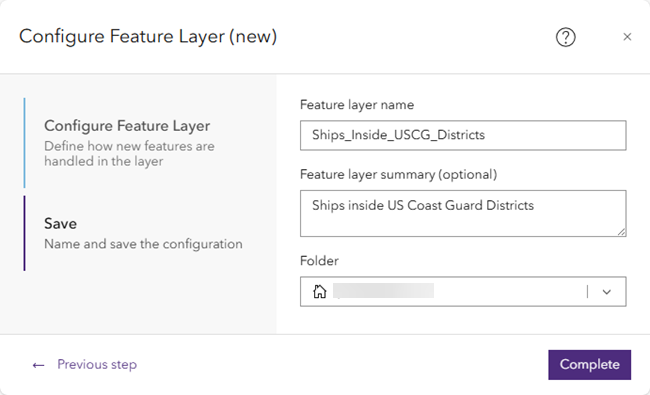
For Save, for Feature layer name, type Ships_Inside_USCG_Districts.
For Feature layer summary (optional), type Ships inside US Coast Guard Districts.
For Folder, choose the folder to save the feature layer.
Click Complete to save the new feature layer output.
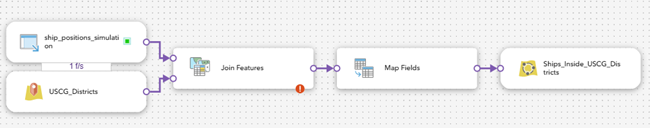
The new feature layer output, Ships_Inside_USCG_Districts, is added to the analytic editor.
Connect the Join Features tool node to the new Ships_Inside_USCG_Districts feature layer output node.
Click Save to save the real-time analytic.
Configure a stream layer output
With the new feature layer output added and the real-time analytic saved, add a second output to send the features to a stream layer.
Note:
The stream layer name must be unique within an organization.
In Velocity, the stream layer name must be different from the feed and spatiotemporal feature layer names.
From the Add Node menu, click Outputs, choose Stream Layer, and configure the output as follows:
For Stream Layer Configuration, click Next to accept the default parameters.
The Also publish a feature layer which keeps the latest observation for each Track ID and Select a related feature layer to provide geometry when stream layer is drawn in a map parameters are not required. When you publish a feature layer, you can publish a separate feature layer that contains only the latest observations. This is useful when you want to symbolize the active position of an asset, in this case a ship, differently in a web map. You can choose a related feature layer that can be used to enrich the output stream layer with additional fields.
For Stream layer name, type Ships_Inside_USCG_Districts_stream.
For Stream layer summary (optional), type Ships inside USCG Districts stream.
For Folder, choose the folder to save the stream layer.
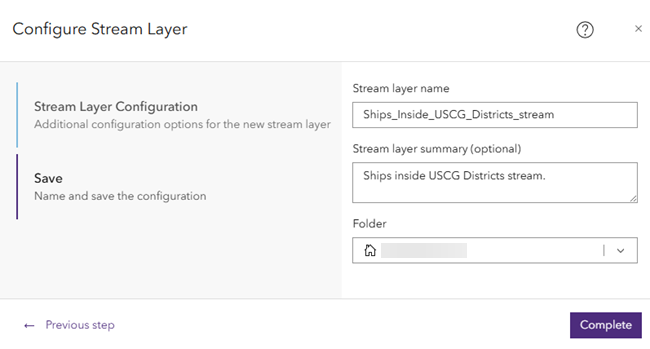
Click Complete to create the stream layer output.
The new stream layer output, Ships_Inside_USCG_Districts_stream, is added to the analytic editor.
Connect the Join Features tool node to the Ships_Inside_USCG_Districts_stream stream layer output node.
Click Save to save the real-time analytic.
Start the real-time analytic
The real-time analytic includes the necessary feed, data source, tool, and outputs and is ready to be started. When started, or running, the analytic receives the simulated ship data, joins it to the name of the U.S. Coast Guard district where each ship is currently located, and writes the event data to the feature layer and stream layer outputs.
In the analytic editor, click Start.
As with feeds, real-time analytics are long-running tasks and continue to run until they are stopped.
The Start button becomes a Stop Initialization and then a Stop button, indicating that the analytic has started and is running.
View the status and monitor the AIS Real Time Processing analytic on the Real-Time Analytics page.
View the real-time analytic metrics
The real-time analytic metrics can be viewed in Velocity. Metrics provide the average rate of events through each element and represent an average rate for each element for the past five minutes of run time. While a real-time analytic is running, the metrics represent the compute usage of the analytic.
Learn more about real-time analytic metrics
In the AIS Real Time Processing real-time analytic, click the Metrics toggle button
 to view metrics for each node in the analytic.
Review the metrics for each node in the real-time analytic. Notice the events per second that each node is processing, the total number of observations in and out, and the compute usage.
Explore layers and results
Once you have created the AIS Real Time Processing analytic, complete the following steps to explore the output layers associated with your analytics and results:
From the main menu, click the Layers tab and explore the Layers page.
The Layers page displays a list of output layers such as feature layers, stream layers, and map image layers.
Layers are created when creating output types in real-time analytics. When the analytic runs, the output layers are automatically created. You can manage the layers and open them in a map viewer to view the features in map.
Familiarize yourself with the options for working with existing layers including the following:
Clicking the edit button to edit a map image layer. You can adjust the default rendering of the dynamic aggregation. For working with map image layers, refer to visualizing map image layers.
Clicking the Open in Map Viewer button to add a layer to a web map.
Clicking the options button to access additional actions including viewing the item details page, opening the layer in the REST Services directory, deleting the layer, and sharing the layer.
Sorting the list by title, type, associated dataset, and modified date.
Every feature layer has an associated map image layer, both of which are based on the same underlying data. Deleting a feature layer also deletes the associated map image layer and the underlying data.
Stream layers visualize real-time data only; there is no dataset.
Examine the output layer
With the real-time analytic running and sending event data to the feature and stream layer outputs, you can add these output layers to a web map directly in the real-time analytic.
From the main menu, under Input, click Feeds to access the Feeds page.
If the ship_positions_simulation feed is not already started, click Start.
From the main menu, under Analytics, click Real-Time to access the Real-Time Analytics page.
If the AIS Real Time Processing real-time analytic is not already started, click Start.
Once the AIS Real Time Processing real-time analytic is running, click the Edit button to edit the analytic.
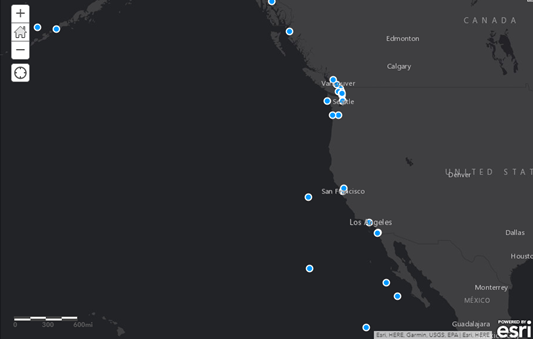
Right-click the Ships_Inside_USCG_Districts feature layer output and choose Open in Map Viewer.
A new browser tab opens Map Viewer in the portal and adds the feature layer to the web map.
Change the basemap to Dark Gray Canvas.
Click Add and choose Add Layer from Web.
Add the U.S. Coast Guard Districts feature layer using the URL
https://services2.arcgis.com/FiaPA4ga0iQKduv3/arcgis/rest/services/US_Coast_Guard_Districts_new/FeatureServer.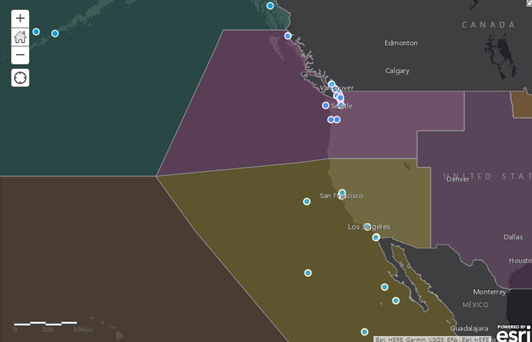
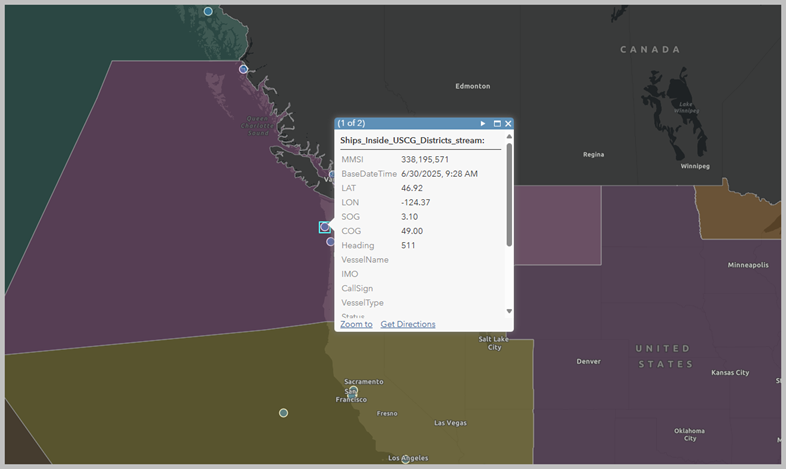
Click one of the ship features to open the pop-up and explore its attributes.
Each observation is enriched with the name of the U.S. Coast Guard district (DistrictName) that the ship is currently in.
Next steps
You created a real-time analytic using Velocity and viewed the output features in a web map. Then you added the Join Features tool to perform spatial enrichment and associated contextual information with the ingested observation data.
If you are interested in using Arcade expressions, refer to Arcade expressions.