Interactive contours
![]() Available with Spatial Analyst license.
Available with Spatial Analyst license.
![]() Available with 3D Analyst license.
Available with 3D Analyst license.
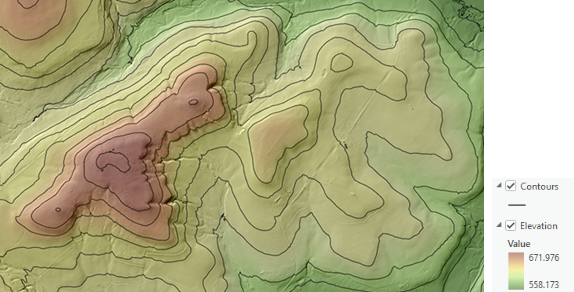
Contours, also called isolines, are lines that connect cells of equal value in a raster. The distribution of contour lines can indicate steepness, flatness, and even the locations of ridges or valleys. The Interactive Contour tool generates contour lines for locations you click on a raster surface. Examples of a raster surface include a digital elevation model (DEM), bathymetry, temperature, or salinity data, and many other environmental variables. You can investigate data by creating contour lines in real time.
Create contours interactively
The Interactive Contour tool ![]() is available in the Analysis group on the contextual Data tab when the following conditions are met:
is available in the Analysis group on the contextual Data tab when the following conditions are met:
Either the Spatial Analyst or 3D Analyst extension is enabled. See Use extensions in ArcGIS Pro for more information.
A map is active and a raster is selected in the Contents pane.
When you click the tool from the Data tab, the pointer updates to a crosshairs symbol. Each click on the map will draw a contour line for that location.
When a location is clicked, the coordinates of the crosshairs are used to identify the cell value of the selected raster surface. A contour line is generated for all connected cells that have the same value. The contour line is only drawn for the display extent at the time the pointer was clicked. Contours are drawn using the screen resolution. This allows for quick response even on very large input rasters. Contours will not be generated in areas of NoData cells.
When you have finished creating contours, press the ESC key to stop creating contours. Alternatively, click the Explore tool ![]() on the Map tab.
on the Map tab.
To create contour lines at the full extent of the data, zoom to the raster's full extent. The geoprocessing contouring tools Contour, Contour List, and Contour with Barriers can be used to create contours at the full extent and resolution of the data.
Learn more about how contouring works.
Input raster types
You can create contours for single-band rasters of either pixel type: integer or floating point. Raster datasets such as mosaic datasets or image services are also supported. If the input is a multiband raster, the tool will operate only on the first band.
Explore your contours
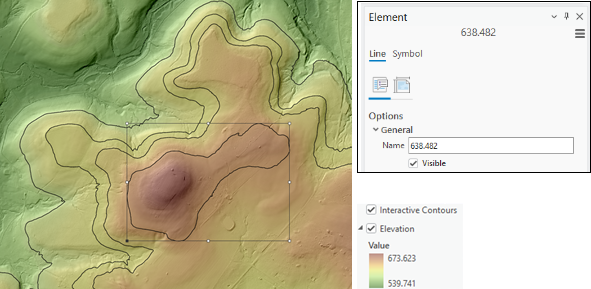
The contour lines will be created as graphic elements and stored within a graphics layer called Interactive Contours. Each contour line is named with the height value of the contour.
You can select contour lines with the Edit group on the Graphics tab on the ribbon. On the Select drop-down menu, choose a tool to select a contour. Right-click the selected contour line and click Properties. This opens the Element pane, where you can view the contour's name and symbology.
You can also adjust the symbology of a contour using the Symbol group on the Graphics tab on the ribbon.
Learn more about working with graphics layers and working with graphic elements in a map.
Remove contour lines
Individual contour lines can be removed from the map using the Graphics tab on the ribbon. Use the Select tools in the Edit group to select the contour lines and then the Delete button in the Edit group to delete them.
Alternatively, you can remove the Interactive Contours graphics layer from the map. Right-click the layer in the Contents pane and click Remove. This removes the graphics layer and all individual contour lines.
Note:
Once the graphics layer is removed from the map, all contour lines are lost.
Convert contours to features
To convert the Interactive Contours graphics layer to a feature class, use the Graphics to Features geoprocessing tool. Once the contours have been converted to features, you can assign attribute values to them, use advanced symbology techniques, or use them in further analyses.