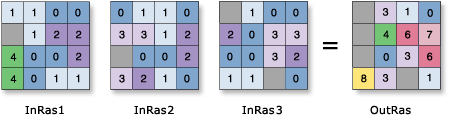
OutRas = CellStatistics([InRas1, InRas2, InRas3], "SUM", "NODATA", "SINGLE_BAND")
Usage
The order of the input rasters is irrelevant for this tool.
For the Maximum, Minimum, Mean, Median, Majority, Minority, Percentile, and Sum statistic types, if a single raster is used as the input, the output cell values will be the same as the input cell values. For Range and Standard deviation, the output cell values will all be 0. For Variety, it will be 1.
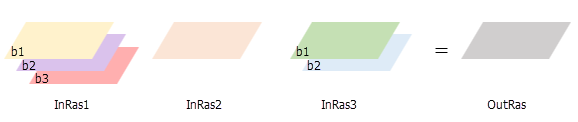
If the Process as multiband parameter is unchecked (process_as_multiband is set to SINGLE_BAND in Python), each band from a multiband raster input will be processed separately as a single band raster, and the output will be a single band raster.
The Cell Statistics tool creates a single-band output when processed as SINGLE_BAND.
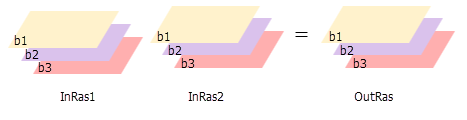
If the Process as multiband parameter is checked (process_as_multiband is set to MULTI_BAND in Python), each multiband raster input will be processed as a multiband raster, and the output will be a multiband raster. The output raster will also be multiband if the inputs are a combination of a multiband raster and constants. The number of bands in each multiband input must be the same.
The tool will perform the operation on each band from one input using the corresponding band from the other input. If one of the inputs is a multiband raster and the other input is a constant, the tool will perform the operation using the constant value for each band in the multiband input.
The Cell Statistics tool creates a multiband output when processed as MULTI_BAND.
If all inputs are multidimensional raster data with the same number of variables, the tool will perform the operation for all slices with the same dimension value. The output will be a multidimensional raster in CRF format. The variables in the inputs must have at least one common dimension and one common dimensional value for this tool to process, otherwise an error will occur.
If all of the inputs have one variable but different names, uncheck the Match Multidimensional Variable geoprocessing environment (set arcpy.env.matchMultidimensionalVariable = False in Python) before performing the operation.
If one or more of the inputs are multidimensional rasters and the other inputs are constant, the tool will perform the operation for all slices for all variables using the constant value, and the output will be a multidimensional raster.
For majority and minority calculations, when there is a tie, the output will be the lowest of the tied values.
When the input raster has rectangular cells, it will be processed so that the output raster cells will be square with sides equal to the average of the rectangular length and width.
A list of input rasters for which a statistical operation will be calculated for each cell in the analysis window.
A number can be used as an input; however, the cell size and extent must first be set in the environment.
If the Process as multiband parameter is checked, all multiband inputs must have an equal number of bands.
Raster Layer; Constant
Overlay statistic
(Optional)
Specifies the statistic type to be calculated.
Mean—The mean (average) of the inputs will be calculated. This is the default.
Majority—The majority (value that occurs most often) of the inputs will be determined.
Maximum—The maximum (largest value) of the inputs will be determined.
Median—The median of the inputs will be calculated.
Minimum—The minimum (smallest value) of the inputs will be determined.
Minority—The minority (value that occurs least often) of the inputs will be determined.
Percentile—The percentile of the inputs will be calculated. The 90th percentile is calculated by default. You can specify other values (from 0 to 100) using the Percentile value parameter.
Range—The range (difference between largest and smallest value) of the inputs will be calculated.
Standard deviation—The standard deviation of the inputs will be calculated.
Sum—The sum (total of all values) of the inputs will be calculated.
Variety—The variety (number of unique values) of the inputs will be calculated.
String
Ignore NoData in calculations
(Optional)
Specifies whether NoData values will be ignored by the statistic calculation.
Checked—At the processing cell location, if any of the input rasters has NoData, that NoData value will be ignored. The statistics will be computed by only considering the cells with valid data. This is the default.
Unchecked—If the processing cell location for any of the input rasters is NoData, the output for that cell will be NoData.
Boolean
Process as multiband
(Optional)
Specifies how the input multiband raster bands will be processed.
Checked—Each multiband raster input will be processed as a multiband raster. The operation will be performed for each band from one input using the corresponding band number from the other inputs.
Unchecked—Each band from a multiband raster input will be processed separately as a single band raster. This is the default.
Boolean
Percentile value
(Optional)
The percentile value that will be calculated. The default is 90, indicating the 90th percentile.
The value can range from 0 to 100. The 0th percentile is essentially equivalent to the minimum statistic, and the 100th percentile is equivalent to the maximum statistic. A value of 50 will produce essentially the same result as the median statistic.
This parameter is only available if the Overlay statistic parameter is set to Percentile.
Double
Percentile interpolation type
(Optional)
Specifies the method of interpolation that will be used when the specified percentile value is between two input cell values.
Auto-detect—If the input rasters are of integer pixel type, the Nearest method will be used. If the input rasters are of floating point pixel type, the Linear method will be used. This is the default.
Nearest—The nearest available value to the desired percentile will be used. In this case, the output pixel type will be the same as that of the input rasters.
Linear—The weighted average of the two surrounding values from the percentile will be used. In this case, the output pixel type will be floating point.
String
Return value
Label
Explanation
Data type
Output raster
The output raster.
For each cell, the value is determined by applying the specified statistic type to the input rasters at that location.
A list of input rasters for which a statistical operation will be calculated for each cell in the analysis window.
A number can be used as an input; however, the cell size and extent must first be set in the environment.
If the processing_as_multiband parameter is set to MULTI_BAND, all multiband inputs should have an equal number of bands.
Raster Layer; Constant
statistics_type
(Optional)
Specifies the statistic type to be calculated.
MEAN—The mean (average) of the inputs will be calculated. This is the default.
MAJORITY—The majority (value that occurs most often) of the inputs will be determined.
MAXIMUM—The maximum (largest value) of the inputs will be determined.
MEDIAN—The median of the inputs will be calculated.
MINIMUM—The minimum (smallest value) of the inputs will be determined.
MINORITY—The minority (value that occurs least often) of the inputs will be determined.
PERCENTILE—The percentile of the inputs will be calculated. The 90th percentile is calculated by default. You can specify other values (from 0 to 100) using the percentile_value parameter.
RANGE—The range (difference between largest and smallest value) of the inputs will be calculated.
STD—The standard deviation of the inputs will be calculated.
SUM—The sum (total of all values) of the inputs will be calculated.
VARIETY—The variety (number of unique values) of the inputs will be calculated.
String
ignore_nodata
(Optional)
Specifies whether NoData values will be ignored by the statistic calculation.
DATA—At the processing cell location, if any of the input rasters has NoData, that NoData value will be ignored. The statistics will be computed by only considering the cells with valid data. This is the default.
NODATA—If the processing cell location for any of the input rasters is NoData, the output for that cell will be NoData.
Boolean
process_as_multiband
(Optional)
Specifies how the input multiband raster bands will be processed.
MULTI_BAND—Each multiband raster input will be processed as a multiband raster. The operation will be performed for each band from one input using the corresponding band number from the other inputs.
SINGLE_BAND—Each band from a multiband raster input will be processed separately as a single band raster. This is the default.
Boolean
percentile_value
(Optional)
The percentile value that will be calculated. The default is 90, indicating the 90th percentile.
The value can range from 0 to 100. The 0th percentile is essentially equivalent to the minimum statistic, and the 100th percentile is equivalent to the maximum statistic. A value of 50 will produce essentially the same result as the median statistic.
This parameter is only supported if the statistics_type parameter is set to PERCENTILE.
Double
percentile_interpolation_type
(Optional)
Specifies the method of interpolation that will be used when the specified percentile value is between two input cell values.
AUTO_DETECT—If the input rasters are of integer pixel type, the NEAREST method will be used. If the input rasters are of floating point pixel type, the LINEAR method will be used. This is the default.
NEAREST—The nearest available value to the desired percentile will be used. In this case, the output pixel type will be the same as that of the input rasters.
LINEAR—The weighted average of the two surrounding values from the percentile will be used. In this case, the output pixel type will be floating point.
String
Return value
Name
Explanation
Data type
out_raster
The output raster.
For each cell, the value is determined by applying the specified statistic type to the input rasters at that location.
Raster
Code sample
CellStatistics example 1 (Python window)
This example calculates the standard deviation per cell on several input Grid rasters and outputs the result as an IMG raster.
This example calculates the range per cell per band on several input multiband rasters and creates a multiband output raster.
# Name: CellStatistics_Ex_standalone.py
# Description: Calculates a per-cell statistic from multiple multiband rasters
#               and process as multiband.
# Requirements: Image Analyst extension

# Import system modules
import arcpy
from arcpy.ia import *

# Set the analysis environments
arcpy.env.workspace = "C:/sapyexamples/data"

# Set the local variables
inRaster01 = "degs_MB"
inRaster02 = "negs_MB"
inRaster03 = "cost_MB"

# Run CellStatistics
outCellStatistics = CellStatistics([inRaster01, inRaster02, inRaster03], "RANGE", "NODATA", "MULTI_BAND")

# Save the output
outCellStatistics.save("C:/sapyexamples/output/cellstats_MB.tif")