Value Percentile Contours (Spatial Analyst Tools)
Summary
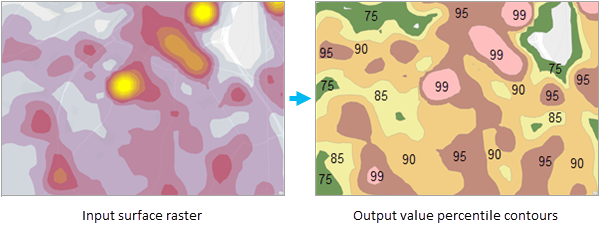
Creates contours that delineate the top p% of a raster by ranking cell values, selecting cells at the percentile threshold, and producing footprints of the extreme areas.
Illustration
Usage
Percentile values can be any values between 0 and 100. A value of 100 may result in an empty or trivial result. A value of 0 returns the entire valid footprint.
The tool ranks the cells by their values in ascending order and returns the top \(p\) percent of raster cells. The percentile threshold is computed from the ranked cell values. The output selects cells that meet or exceed the threshold value.
The footprint of the output contour polygon indicates the area enclosed by the percentage of the total sum of the extreme values above the specified percentile.
In case of repeated values at the threshold, all the repeated values will be selected. As a result, adjacent percentiles can produce the same threshold and output contour polygon. However, the tool will not under-select values relative to the specified percentile.
When multiple percentile values are specified, output polygons will be nested. The innermost polygon corresponds to the highest values, and the outermost polygon covers the smaller values.
The Planar option for the Method parameter is appropriate if the analysis is performed at a local scale with a projection that accurately maintains the correct distance and area.
Use the Geodesic option to perform analysis at a regional or large scale (for example, using Web Mercator or any geographic coordinate system). This option accounts for the curvature of the spheroid and correctly handles data near the poles and the international dateline.
If the Ignore Negative Values parameter is unchecked, the tool will include negative input cell values in the calculation.
The input surface raster must be a single-band raster.
If the goal is to create polygons based on cumulative magnitude of the cell values, use the Volume Percentile Contours tool instead.
See Analysis environments and Spatial Analyst for additional details on the geoprocessing environments that apply to this tool.
Parameters
| Label | Explanation | Data type |
|---|---|---|
|
Input Surface Raster |
The input raster that contour polygons will be calculated for. It must be a continuous raster. The input raster data type can be integer or floating point. |
Raster Layer |
|
Output Contour Polygons |
The output contour polygon features. The output includes contour polygons for all the specified percentile values. |
Feature Class |
|
Percentile Values (Optional) |
The percentile values that contours will be calculated for. The default is 90, indicating the 90th percentile. The values can range from 0 to 100. |
Double |
|
Method (Optional) |
Specifies whether the calculation will be based on a planar (flat earth) or a geodesic (ellipsoid) method. The planar method is appropriate to use on local areas in a projection that maintains correct distance and area. It is suitable for analyses that cover areas such cities, counties, or smaller states in area. The geodesic method produces a more accurate result at the potential cost of an increase in processing time.
|
String |
|
Ignore Negative Values (Optional) |
Specifies whether negative values will be ignored in the value percentile calculation.
|
Boolean |
|
Smooth Outputs (Optional) |
Determines if the output polygons will be smoothed into simpler shapes or conform to the input raster's cell edges.
|
Boolean |
Environments
Auto Commit, Current Workspace, Default Output Z Value, Extent, Geographic Transformations, M Resolution, M Tolerance, Parallel Processing Factor, Output CONFIG Keyword, Output Coordinate System, Output has M values, Output has Z values, Output M Domain, Output XY Domain, Output Z Domain, Scratch Workspace, XY Resolution, XY Tolerance, Z Resolution, Z Tolerance
Licensing information
- Basic: Requires Spatial Analyst
- Standard: Requires Spatial Analyst
- Advanced: Requires Spatial Analyst