Calculate Composite Index (Spatial Statistics Tools)
Summary
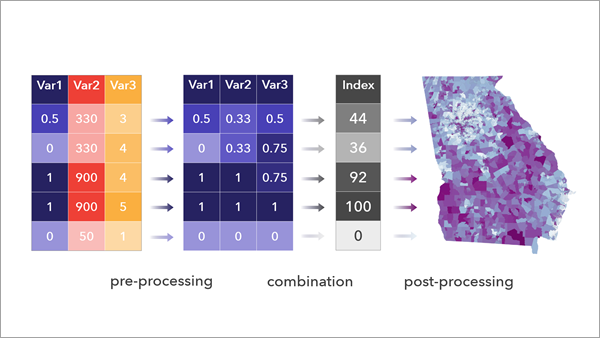
Combines multiple numeric variables to create a single index.
Composite indices are used across social and environmental domains to represent complex information from multiple indicators as a single metric that can measure progress toward a goal and facilitate decisions. The tool supports the three main steps of the index creation process: standardize input variables to a common scale (preprocessing), combine variables to a single index variable (combination), and scale and classify the resulting index to meaningful values (postprocessing).
Illustration
Usage
Creating an appropriate index depends on careful consideration of the question the index is trying to answer, variable choice, and the methods applied. These should be done in consultation with domain experts and end users.
Learn more about best practices when creating composite indices
Use the Input Variables parameter to designate numeric fields to use in the index. The tool omits records with missing values in any input variable.
You can use the Preset Method to Scale and Combine Variables parameter to specify a method for creating an index. For example, the Combine values (Mean of scaled values) option scales the input variables between 0 and 1 and uses the mean of the rescaled input variables as the index.
- The Preset Method to Scale and Combine Variables parameter will change the values of the Method to Scale Input Variables and Method to Combine Scaled Variables parameters. To customize these further, choose the Custom option to set their values manually.
The Method to Scale Input Variables parameter will apply the selected method to all input variables.
The Minimum-maximum option is the simplest, as it preserves the distribution of the input variables and scales to a 0 to 1 scale that is easy to interpret.
When working with variables that have skewed distributions or outliers, use the Percentile or Rank method, which consider the rank of the data, or use the Flag by threshold (binary) option, which converts the variables to binary (0 or 1) values.
To create an index that will be re-created over time as new data is available—such as a yearly performance index—use the Minimum-maximum (custom data ranges) or Z-score (custom) option. Using either of these options, you can set stable benchmarks that allow comparisons across data with different ranges and distributions.
The Raw values option is useful when the variables are on a comparable scale, such as when using percentages or when the variables have been preprocessed using other tools.
Use the Transform Field, Standardize Field, or Reclassify Field tools if you need to apply preprocessing methods that are not available in the tool or when different preprocessing methods are needed for each input variable.
When performing preprocessing, ensure that the input variables are on a comparable scale.
Use the Raw values option of the Method to Scale Input Variables parameter when performing your own preprocessing.
If all the input variables are on a common measurement scale, such as percentages, use the Raw values option of the Method to Scale Input Variables parameter.
The Flag by threshold (binary) option of the Method to Scale Input Variables parameter can be used to convert the input variables to values of 0 and 1 based on thresholds. Use the Method to Scale for Thresholds parameter to optionally apply a preprocessing step to all variables prior to setting the threshold. For example, the following steps count the number of input variables that are above the 90th percentile for each location:
Set the Method to Scale Input Variables parameter value to Flag by threshold (binary).
Set the Method to Scale for Thresholds parameter value to Percentile.
Set the Thresholds parameter value to Greater than 0.9 for each variable.
Set the Method to Combine Scaled Variables parameter value to Sum.
The Method to Combine Scaled Variables parameter includes additive methods (sum and mean) and multiplicative methods (multiply and geometric mean).
Additive methods allow a variable with a high value to compensate for variables with low values.
Multiplicative methods do not allow high values to compensate for low values. High index values occur only when there are high values in multiple variables.
You can use the Weights parameter (in the Variable Weights parameter category) to indicate the relative importance of each input variable. All weights are set to 1 by default, meaning that each variable is equally weighted.
If you know that a variable should be twice as important as another variable, set the variable to a weight of 2, and the other variable to a weight of 1.
You can also set weights that add up to 1; for example, if three variables are used and one should be considered to be twice as important as the other two, you can use weight values of 0.5, 0.25, and 0.25.
Weights have a significant impact on the resulting index. Setting the relative importance of variables is a subjective part of the analysis and should be driven by domain knowledge and documented justification.
The tool will create an index field, a rank field, and a percentile field. An index raw field will also be created when reversing or when the index is scaled to a new minimum and maximum. Additional fields will be added for each of the classification options specified in the Additional Classified Outputs parameter. If the input is a feature class and a feature class is specified in the Output Features or Table parameter, the tool will provide a group layer displaying a layer for the index field, the percentile field, and each of the selected classification options.
The output index layer will include charts to view the distribution of the index, help identify whether the preprocessing steps achieved the intended result, and check for correlations among input variables and the index.
The output index layer includes a pop-up visualization you can use to examine the values of the resulting index and input variables at specific locations.
The concept that the index is measuring may be represented by multiple dimensions. For example, a vulnerability index might be composed of housing, transportation, and income domains, each comprising multiple variables. Consider constructing subindices to represent each dimension. This is achieved by running the tool multiple times, once for each dimension, and using the results as the input variables to the final index.
When constructing an index that comprises subindices, consider using ModelBuilder or a notebook in ArcGIS Pro to streamline this process. If using ModelBuilder, create new features for each subindex by unchecking the Append Fields to Input Table parameter. This will create a separate output for each subindex, which should be joined together before creating the final index. The tool does not support chaining multiple indices together in ModelBuilder when the Append Fields to Input Table parameter is checked.
A best practice is to reduce the number of input variables while keeping enough to capture the essential information needed for the index. A large number of input variables may result in difficulty when interpreting the index. Additionally, if multiple variables pertain to the same domain, for example, median income and poverty, the influence of this domain may be overrepresented in the index.
Parameters
| Label | Explanation | Data type |
|---|---|---|
|
Input Table |
The table or features containing the variables that will be combined into the index. |
Table View |
|
Input Variables |
A list of numeric fields representing the variables that will be combined as an index. Check the Reverse Direction check box to reverse the values of the variables. This means that the feature or record that originally had the highest value will have the lowest value, and vice versa. Value table columns:
|
Value Table |
|
Append Fields to Input Table (Optional) |
Specifies whether the results will be appended to the input data or provided as an output feature class or table.
|
Boolean |
|
Output Features or Table (Optional) |
The output features or table that will include the results. |
Table; Feature Class |
|
Preset Method to Scale and Combine Variables (Optional) |
Specifies the workflow that will be used when creating the index. The options represent common index creation workflows; each option sets default values for the Method to Scale Input Variables and Method to Combine Scaled Variables parameters.
|
String |
|
Method to Scale Input Variables (Optional) |
Specifies the method that will be used to convert the input variables to a common scale.
|
String |
|
Method to Scale for Thresholds (Optional) |
Specifies the method that will be used to convert the input variables to a common scale prior to setting thresholds.
|
String |
|
Custom Standardization (Optional) |
The custom mean value and custom standard deviation that will be used when standardizing each input variable. For each variable, provide the custom mean in the Mean column and the custom standard deviation in the Standard Deviation column. Value table columns:
|
Value Table |
|
Custom Data Ranges (Optional) |
The possible minimum and maximum values that will be used in the units of the variables. Each variable will be scaled between 0 and 1 based on the possible minimum and maximum values. Value table columns:
|
Value Table |
|
Thresholds (Optional) |
The threshold that determines whether a feature will be flagged. Specify the value in the units of the scaled variables and specify whether values above or below the threshold value will be flagged. Value table columns:
|
Value Table |
|
Method to Combine Scaled Variables (Optional) |
Specifies the method that will be used to combine the scaled variables into a single value. You cannot multiply or calculate a geometric mean when any variables are scaled using z-scores, because z-scores always contain negative values.
|
String |
|
Weights (Optional) |
The weights that will set the relative influence of each input variable on the index. Each weight has a default value of 1, meaning that each variable has equal contribution. Increase or decrease the weights to reflect the relative importance of the variables. For example, if a variable is twice as important as another, use a weight value of 2. Using weight values larger than 1 while multiplying to combine scaled values can result in indices with very large values. Value table columns:
|
Value Table |
|
Output Index Name (Optional) |
The name of the index. The value is used in the visualization of the outputs, such as field aliases and chart labels. The value is not used when the output (or appended input) is a shapefile. |
String |
|
Reverse Output Index Values (Optional) |
Specifies whether the output index values will be reversed in direction (for example, to treat high index values as low values).
|
Boolean |
|
Output Index Minimum and Maximum Values (Optional) |
The minimum and maximum of the output index values. This scaling is applied after combining the scaled variables. If no values are provided, the output index is not scaled. Value table columns:
|
Value Table |
|
Additional Classified Outputs (Optional) |
Specifies the method that will be used to classify the output index. An additional output field will be provided for each selected option.
|
String |
|
Output Index Number of Classes (Optional) |
The number of classes that will be used for the equal interval and quantile classification methods. |
Long |
|
Output Index Custom Classes (Optional) |
The upper bounds and class values for the custom classification method. For example, you can use this variable to classify an index containing values between 0 and 100 into classes representing low, medium, and high values based on custom break values. Value table columns:
|
Value Table |
Derived output
| Label | Explanation | Data type |
|---|---|---|
|
Updated Input Table |
The updated input table. |
Table View |
|
Output Layer Group |
If the input was a feature class and a feature class is specified for the Output Features or Table parameter, a group layer is provided displaying a layer for the index field, the percentile field, and each of the selected classification options. |
Group Layer |
Environments
Extent, Output Coordinate System
Licensing information
- Basic: Yes
- Standard: Yes
- Advanced: Yes