How Assign Weights by Pairwise Comparison works
In a suitability model, figuring out how to best weight many criteria together to determine their relative importance can be difficult and subjective. However, you can more accurately compare pairs of criteria. For example, it can be a challenge to identify what the relative weights for five criteria (such as slope, aspect, distance to water, distance to roads, and elevation) should be in a suitability model. However, you can more easily decide between two criteria which one is more important and by how much.
When a multicriteria decision-making approach needs to be applied to solve a problem, various fields use a pairwise comparison method (Saaty 2008). Applications include ecological habitat modeling, business site selection, and identifying health risk indices. The advantage of pairwise weighting is that comparing criteria two at a time simplifies complex decisions and provides you with a systematic way to prioritize or rank the input criteria. Since you can more accurately compare pairs of criteria relative to one another, the final calculated weights can be more objective.
This method is particularly useful when dealing with intangible factors that cannot be measured directly but are essential to decision making. By applying expert judgment, it is possible to derive priority scales that measure the factors in relative terms.
In Suitability Modeler, you can use the consistency ratio value to evaluate the comparison matrix. This helps ensure that the pairwise comparisons are consistent (for example, if A > B, and B > C, then C cannot be greater than A).
Example applications
In the Suitability Modeler, pairwise comparison is applicable in two areas:
Calculating the weights for multiple criteria in a suitability model.
Determining the weights for a set of submodels for a composite suitability model.
Comparison matrix
The comparison matrix is an essential part of the pairwise methodology. The matrix is populated with the pairwise preferences from which the weights are calculated.
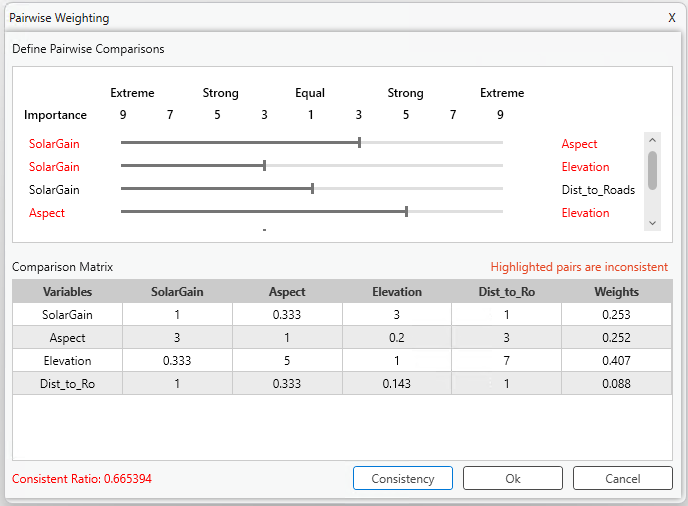
In the Pairwise Weighting dialog, adjust the slider for each pair to convey your comparison preference. Move the slider away from the midpoint toward one of the criteria to show a stronger preference for that criterion. Keeping the slider in the center means both criteria are equally important. This process involves making subjective judgments based on your knowledge, experience, or preferences.
In the matrix, the intersection of each row with each column represents a pair of criteria to compare. The comparison matrix dynamically updates as you move each slider. The selected values of the sliders are assigned to the cell in the corresponding row (the more important criterion) and column (the less important criterion). Its reciprocal value (1/value) is assigned to the opposite position in the matrix.
For example, consider the example of a solar farm suitability model, where two of the criteria are elevation and the amount of solar gain. You might consider the solar gain criterion to be twice as important as elevation. To reflect this evaluation, adjust the slider for the two criteria to the solar gain side and set it to be between 1 and 3 in the scale. In the Comparison Matrix, the value of the cell where the row is solar gain and the column is elevation will be updated to 2. Accordingly, the value of cell where the row is elevation and the column is solar gain will be assigned the value 0.5 (the reciprocal value of 2 is \(\frac {1}{2}\)).
Pairwise comparison calculations
Weights from a comparison matrix are calculated in a multistep process. The image below shows an example scenario of a comparison matrix for five criteria, the solar gain, aspect, elevation, distance to roads, and distance to electrical power lines. The four steps involved in calculating the weights for this example are illustrated below.
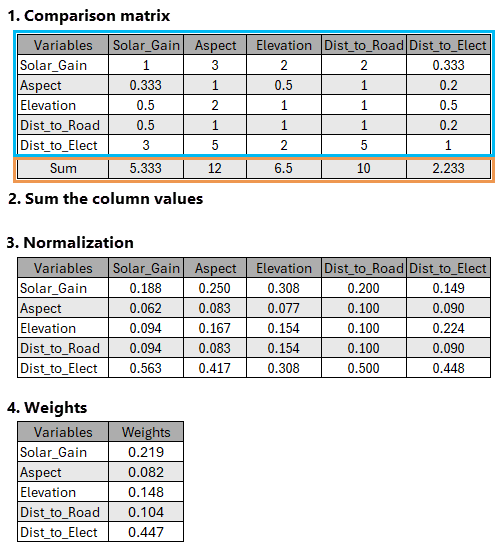
Comparison matrix
The first step is creating the comparison matrix that identifies the pairwise evaluations for the input criteria.
Sum the column values
Next, the cell values for each column are added together. The resulting column total is used to normalize the values within that column.
In the example in the image above, the first column, Solar_Gain, contains the values 1, 0.333, 0.5, 0.5, and 3, which sums to 5.333.
The total of 5.333 will be used to normalize each value in the first column in the next step.
Normalization
Each normalized value for each comparison pair is calculated by dividing the corresponding comparison value by the total of its column.
In this example, for the Solar_Gain column, the value for the Solar_Gain row is the result of 1 / 5.333 ≈ 0.188. For the Aspect row, the result is 0.333 / 5.333 ≈ 0.062, and so on for the rest of the cells.
Weights
The final weight for each criterion is the average of all the normalized cells in each row.
For the Solar_gain row, the weight is calculated as follows:
\(w_{Solar\_gain}=\frac{0.188\ +\ 0.250\ +\ 0.308\ +\ 0.200\ +\ 0.149}{5}=0.219\)
The weight calculation will be performed for each criterion.
Adjust the consistency ratio
In the Pairwise Weighting window, click the Consistency button to review the consistency among the comparisons of all the pairs. The consistency ratio appears at the bottom left corner. If the ratio is greater than 0.1, the comparisons are not consistent. To convey this, the consistent ratio value will be displayed in a red color, as will the three most inconsistent of the comparison pairs. To ensure consistency, you can adjust the inconsistent comparisons using the sliders.
The example below shows three criteria pairs that are inconsistent and one criteria pair where the comparison is consistent.
See Calculate the consistency ratio for a more information about how the consistency ratio is determined.
When you click Ok in the Pairwise Weighting dialog, the weights will be assigned to each criterion in the Suitability tab. When the Weight by parameter on the Settings tab is set to Multiplier, the weights in the comparison matrix will be multiplied by 10 before assigning them as the weights to the criteria. If Percent is selected, the weights in the comparison matrix will be multiplied by 100 before assigning them as the weights to the criteria.
References
Saaty, T. L. 2008. "Decision making with the analytic hierarchy process". International Journal of Services Sciences, 1(1), 83-98.