Apply dynamic segmentation
 Available with the Linear Referencing license.
Use the Dynamic Segmentation tool to create an output in which the events on a route are dynamically segmented together into one record set. The tool returns separate records at any measure along the event where any of the attributes change.
Before using this tool to edit a feature service, you must share branch versioned linear referencing system (LRS) data as a web layer. If the feature service is not yet published, see Share as web layers.
This tool has multiple use cases depending on organizational needs and provides the basis of analysis to evaluate regulatory, policy, and budgetary options. The following are examples:
Analyze pipeline conditions using other variables to determine the allocation of funds for maintenance.
Analyze road conditions using variables such as traffic and jurisdiction to determine the allocation of funds for maintenance.
Provide a cross event check to ensure data accuracy along a route.
Provide a cross event check to ensure Highway Performance Monitoring System (HPMS) data accuracy along a route.
Check for gaps in the data and fill them.
Note:
If you experience poor performance or failures when running this tool, increase the heap size at the service level.
This tool is similar to the Overlay Events tool. The difference between the two tools is that you can edit the event data in an ArcGIS Pro edit session with the Dynamic Segmentation tool. The Overlay Events tool outputs a feature class or table that represents the dynamic segmentation of the inputs, but that output is not connected to the input events for editing.
Return a dynamic segmentation output
To return a dynamic segmentation output, complete the following steps:
Start ArcGIS Pro and add the LRS Network and line event feature classes to a map.
You can also open a map in which the LRS Network and line event layers are present.
Optionally, zoom to the location or routes on the map where you want to apply dynamic segmentation.
On the Linear Referencing tab, in the Event Editing group, click DynSeg
 .
The Dynamic Segmentation pane appears.
Click the Network drop-down arrow and choose the LRS Network to which you want to apply dynamic segmentation.
Click the Line Attribute Set drop-down arrow and choose a line attribute set.
The events in the chosen attribute set are used for dynamic segmentation.
Optionally, click the Point Attribute Set drop-down arrow and choose a point attribute set.
The events in the chosen attribute set are used for dynamic segmentation.
Click Select one or more routes to select one or more routes on the map with the events you want to segment.
You can use any of the provided interactive selection tools to populate the Routes list.
If routes are already selected when the network is specified, they're added to the Routes list.
Click Run to apply dynamic segmentation to the selection set.
An output feature class, Dynamic Segmentation, is created and added to the Contents pane.
Edit records in the output feature class
You can edit the events in the Dynamic Segmentation output feature class in the same way you edit events in an event layer's attribute table. You can perform dynamic segmentation edits to correct errors, reflect changes to measures on an associated route, and update the value of unique event attributes.
To edit events in the Dynamic Segmentation output feature class after running the Dynamic Segmentation tool , complete the following steps:
Right-click the Dynamic Segmentation output feature class in the Contents pane and click Attribute Table.
The attribute table appears.
Double-click a cell in the table to update its value.
Note:
The following fields are not editable:
OBJECTID,route_id,from_date,to_date,event_type,from_measure,to_measure,SHAPE, andSHAPE_Length.A line event's user-managed fields are editable when the
event_typefield is set to Line, whereas a point event's user-managed fields are editable when theevent_typefield is set to Point.
Tip:
If you are using a tool such as Calculate Field to edit the table, the Save Edits button becomes enabled once you enable the Enable Undo option in the tool, or if you already edited the feature before using the tool.
If a message about acquiring locks appears, it means that conflict prevention is enabled.
On the Edit tab, click Save Edits to save the changes.
The edits you make in the Dynamic Segmentation output feature class are applied to the individual event layers.
Note:
When you check Merge coincident events in the Dynamic Segmentation table in the Linear Referencing options, the tool merges coincident events that have exactly the same attributes.
Dynamic segmentation scenario
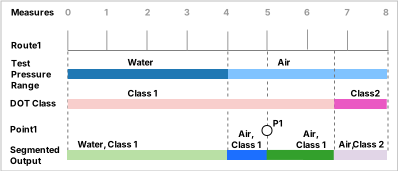
In the following diagram, two line event layers, Test Pressure Range and DOT Class, and a point event layer, Point 1, are associated with a single route, Route 1.
In the following diagram, two line event layers, Speed Limit and Functional Class, and a point event layer, P1, are associated with a single route, Route 1. Each event layer has different values along the route measures indicated by the color changes.
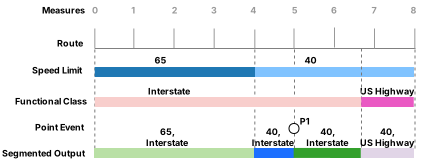
The route is calibrated from left to right between measures 0 and 8. The three events are present on the route and have the input and output tables described in the subsections below.
Input events
The following tables show the input events' measures and values:
Test Pressure Range
| Route ID | Event ID | From Measure | To Measure | From Date | To Date | Test Medium |
|---|---|---|---|---|---|---|
| Route1 | Event1 | 0 | 4 | 1/1/2000 | <Null> | Water |
| Route1 | Event2 | 4 | 8 | 1/1/2000 | <Null> | Air |
DOT Class
| Route ID | Event ID | From Measure | To Measure | From Date | To Date | DOT Class |
|---|---|---|---|---|---|---|
| Route1 | Event1 | 0 | 6.7 | 1/1/2000 | <Null> | Class1 |
| Route1 | Event2 | 6.7 | 8 | 1/1/2000 | <Null> | Class2 |
Speed Limit
| Route ID | Event ID | From Measure | To Measure | From Date | To Date | Speed Limit |
|---|---|---|---|---|---|---|
| Route1 | Event1 | 0 | 4 | 1/1/2000 | <Null> | 65 |
| Route1 | Event2 | 4 | 8 | 1/1/2000 | <Null> | 40 |
Functional Class
| Route ID | Event ID | From Measure | To Measure | From Date | To Date | Functional Class |
|---|---|---|---|---|---|---|
| Route1 | Event1 | 0 | 6.7 | 1/1/2000 | <Null> | Interstate |
| Route1 | Event2 | 6.7 | 8 | 1/1/2000 | <Null> | US Highway |
Point 1
| Route ID | Event ID | Measure | From Date | To Date | Code |
|---|---|---|---|---|---|
| Route1 | Event1 | 5 | 1/1/2000 | <Null> | P1 |
Output feature class
The Dynamic Segmentation output feature class and accompanying attribute table are dynamically created using data from associated point and line events. The attribute table is editable, and the edits are applied to the individual event layers.
Moving in the direction of calibration of the route (from left to right), the first segment is caused by the Test Pressure Range value, Water, which starts at measure 0 and ends at measure 4.
The second segment is caused by the Test Pressure Range value, Air, which starts at measure 4 and ends at measure 5 due to the presence of the point event, P1.
The third segment is caused by the point event, P1, at measure 5.
The fourth segment, between measures 5 and 6.7, contains the Test Pressure Range value, Air, and the DOT Class value, Class 1.
The final segment, between measures 6.7 and 8, contains the Test Pressure Range value, Air, and the DOT Class value, Class 2.
The following table shows the dynamic segmentation output:
| Route ID | Type | Section | From Measure | To Measure | From Date | To Date | Test Pressure Range | DOT Class | Code |
|---|---|---|---|---|---|---|---|---|---|
| Route1 | Line | 1 | 0 | 4 | 1/1/2000 | <Null> | Water | Class 1 | |
| Route1 | Line | 2 | 4 | 5 | 1/1/2000 | <Null> | Air | Class 1 | |
| Route1 | Point | 3 | 5 | 5 | 1/1/2000 | <Null> | Air | Class 1 | P1 |
| Route1 | Line | 4 | 5 | 6.7 | 1/1/2000 | <Null> | Air | Class 1 | |
| Route1 | Line | 5 | 6.7 | 8 | 1/1/2000 | <Null> | Air | Class 2 |
Moving in the direction of calibration of the route (from left to right), the first segment is caused by the Speed Limit value, 65, which starts at measure 0 and ends at measure 4.
The second segment is caused by the Speed Limit value, 40, which starts at measure 4 and ends at measure 5 due to the presence of the point event, P1.
The third segment is caused by the point event, P1, at measure 5.
The fourth segment, between measures 5 and 6.7, contains the Speed Limit value, 40, and the Functional Class value, Interstate.
The final segment, between measures 6.7 and 8, contains the Speed Limit value, 40, and the Functional Class value, US Highway.
The following table shows the dynamic segmentation output:
| Route ID | Type | Section | From Measure | To Measure | From Date | To Date | Speed Limit | Functional Class | Code |
|---|---|---|---|---|---|---|---|---|---|
| Route1 | Line | 1 | 0 | 4 | 1/1/2000 | <Null> | 65 | Interstate | |
| Route1 | Line | 2 | 4 | 5 | 1/1/2000 | <Null> | 40 | Interstate | |
| Route1 | Point | 3 | 5 | 5 | 1/1/2000 | <Null> | 40 | Interstate | P1 |
| Route1 | Line | 4 | 5 | 6.7 | 1/1/2000 | <Null> | 40 | Interstate | |
| Route1 | Line | 5 | 6.7 | 8 | 1/1/2000 | <Null> | 40 | US Highway |