Block Statistics (Spatial Analyst Tools)
Summary
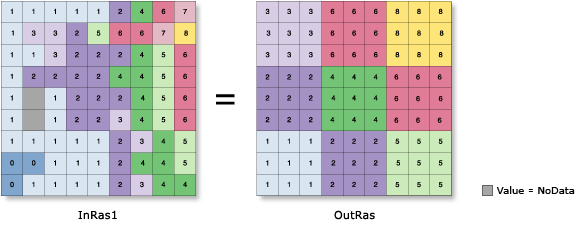
Partitions the input into non-overlapping blocks and calculates the statistic of the values within each block. The value is assigned to all of the cells in each block in the output.
Illustration
Usage
There are several neighborhood shapes and statistics types to choose from. The available statistics depend on the type of the input raster.
The available neighborhood shapes are annulus (a donut or ring), circle, rectangle, and wedge. A custom neighborhood shape can be defined using a kernel file.
When a circular, annulus-shaped, or wedge-shaped neighborhood is specified, depending on the size of the neighborhood, cells that are not perpendicular to the x- or y-axis may not be considered in the calculations. However, these cell locations will receive the resulting value from the calculations of the neighborhood because they fall within the minimum-bounding rectangle (or the output block) of these circular neighborhood types.
The irregular and weight Neighborhood types require that a Kernel file value be specified. A kernel file is an ASCII text file that specifies the values and shape of the neighborhood. The file can be created with any plain text editor. The file must have a
.txtextension and no spaces in the file name.See the Irregular and Weight sections of How Block Statistics works for information about creating and using kernel files.
For integer input rasters, the valid choices for Statistics type are: majority, maximum, mean, median, minimum, minority, range, standard deviation, sum, and variety. For float input rasters, the valid statistics are: maximum, mean, minimum, range, standard deviation, and sum. Majority, median, minority, and variety are not available.
If the input raster is integer, the output raster will be integer for the following statistics: majority, maximum, median, minimum, minority, range, sum, and variety. The output will be float for the mean and standard deviation statistics.
If the input raster is of float type, the output will be float for all of the available statistic types.
For median calculations, if a block neighborhood has an odd number of cells, the values will be ranked and the middle value will be reported as the median. If a block has an even number of cells, the values are ranked and from the two middle values, the lower one is selected.
For majority and minority calculations, when there is a tie, the output will be the lowest of the tied values.
The Neighborhood parameter can be set to Weight only for the Mean, Standard deviation, and Sum statistics types.
See Analysis environments and Spatial Analyst for additional details on the geoprocessing environments that apply to this tool.
Parameters
| Label | Explanation | Data type |
|---|---|---|
|
Input raster |
The raster for which a statistic will be calculated for blocks of cells. |
Raster Layer |
|
Neighborhood (Optional) |
The cells of the processing block that will be used in the statistic calculation. There are several predefined neighborhood types to choose from, or a custom kernel can be defined. Once the neighborhood type is selected, other parameters can be set to fully define the shape, size, and units of measure. The default neighborhood is a square rectangle with a width and height of three cells. The following are the forms of the available neighborhood types:
For the annulus, circle, rectangle and wedge neighborhood types, the distance units for the parameters can be specified in Cell units or Map units. Cell units is the default. For kernel neighborhoods, the first line in the kernel file defines the width and height of the neighborhood in numbers of cells. The subsequent lines indicate how the input value that corresponds to that location in the kernel will be processed. A value of 0 in the kernel file for either the irregular or the weight neighborhood type indicates the corresponding location will not be included in the calculation. For the irregular neighborhood, a value of 1 in the kernel file indicates that the corresponding input cell will be included in the operation. For the weight neighborhood, the value at each position indicates what the corresponding input cell value is to be multiplied by. Positive, negative, and decimal values can be used. |
Neighborhood |
|
Statistics type (Optional) |
Specifies the statistic type to be calculated. The default statistic type is Mean. If the input raster is integer, all the statistics types will be available. If the input raster is floating point, only the Mean, Maximum, Minimum, Range, Standard deviation, and Sum statistic types will be available.
|
String |
|
Ignore NoData in calculations (Optional) |
Specifies whether NoData values will be ignored by the statistic calculation.
|
Boolean |
Return value
| Label | Explanation | Data type |
|---|---|---|
|
Output raster |
The output block statistics raster. |
Raster |
Environments
Auto Commit, Cell Size, Cell Size Projection Method, Compression, Current Workspace, Extent, Geographic Transformations, Mask, Output CONFIG Keyword, Output Coordinate System, Scratch Workspace, Snap Raster, Tile Size
Licensing information
- Basic: Requires Spatial Analyst
- Standard: Requires Spatial Analyst
- Advanced: Requires Spatial Analyst