Linear Spectral Unmixing (Spatial Analyst Tools)
Summary
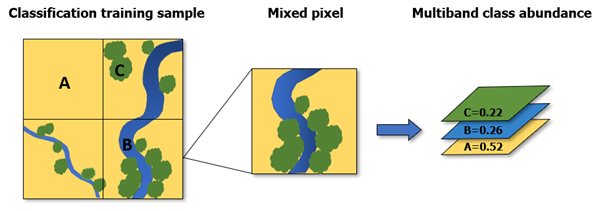
Performs subpixel classification and calculates the fractional abundance of different land-cover types for individual pixels.
Usage
This tool calculates the fractional material for individual pixels that contain multiple materials. It generates a multiband raster in which each band corresponds to the fractional abundance of each land-cover class. For example, you can use it to perform land-cover classification on a multispectral image to identify photosynthetic vegetation, bare soil, and dead or nonphotosynthetic vegetation.
This tool supports several forms of spectral data input, such as Esri spectral library (
.esl) or ENVI spectral library format (.sli).The tool supports a legacy form of the JSON spectra input. The following is an example of a spectral file provided as a
.jsonfile:{ "EsriEndmemberDefinitionFile" : 0, "FileVersion" : 1, "NumberOfEndmembers" : 3, "NumberOfBands" : 7, "Endmembers" : [ { "EndmemberID" : 1, "EndmemberName" : "urban", "SpectralProfile" : [ 88, 42, 48, 38, 86, 115, 59 ] }, { "EndmemberID" : 2, "EndmemberName" : "vegetation", "SpectralProfile" : [ 50, 21, 20, 35, 50, 110, 23 ] }, { "EndmemberID" : 3, "EndmemberName" : "water", "SpectralProfile" : [ 51, 20, 14, 9, 7, 116, 4 ] } ] }Classifier definition files (
.ecd) generated from the Train Maximum Likelihood Classifier tool are the only classifier output currently supported.Polygon features require the following field names:
classname—A text field indicating the name of the class categoryclassvalue—A long integer field containing the integer value for each class category
When calculating the fractional abundance of each land-cover class, the solution may include negative coefficients or fractions. If this occurs, review the training samples in the input spectral profile to confirm that they accurately represent each class. If they appear correct, specify Non-negative for Output Value Option.
The number of bands in the input image and input spectral data must match if the spectral input is an
.ecdfile, a training sample feature class, or a.jsonfile.If the input spectra is from a spectral library file (
.eslor.sli), spectral resampling will be applied using a band average method if the number of bands do not match. Optionally, you can resample spectra using the Resample Library Spectra tool in the Image Analyst toolbox.If the spectral data is from a spectral library in which the reflectance values range between 0 and 1, such as the USGS spectral library, the input surface reflectance raster must also contain values between 0 and 1.
If the input image is not within 0-1, such as 8 bit or 16 bit, it is recommend that you collect the material's spectral signature from imagery using the Spectral Viewer tool in the Image Analyst toolbox. Optionally, check the Remove continuum check box to normalize the pixel values and the input spectra library data.
When the Remove continuum check box is checked, a convex hull is fitted over the top of a spectrum using straight-line segments that connect local spectra maxima. The continuum will be removed by dividing it into the actual spectrum for each pixel in the image and the input spectra. This allows comparison of absorption features from a common baseline.
Parameters
| Label | Explanation | Data type |
|---|---|---|
|
Input Raster |
The input surface reflectance raster dataset. |
Raster Dataset; Mosaic Dataset; Mosaic Layer; Raster Layer; File; Image Service |
|
Spectra File or Training Features |
The spectral information for the different land-cover classes. The file can be any of the following:
|
File; Feature Layer; String |
|
Output Value Option (Optional) |
Specifies how the output pixel values will be defined.
|
String |
|
Remove continuum (Optional) |
Specifies whether the spectra will be normalized from an image or reference data.
|
Boolean |
Return value
| Label | Explanation | Data type |
|---|---|---|
|
Output Raster |
The output multiband raster dataset. |
Raster |
Environments
Compression, Current Workspace, Geographic Transformations, NoData, Output CONFIG Keyword, Output Coordinate System, Extent, Parallel Processing Factor, Pyramid, Raster Statistics, Resampling Method, Scratch Workspace, Snap Raster, Tile Size
Licensing information
- Basic: Requires Spatial Analyst or Image Analyst
- Standard: Requires Spatial Analyst or Image Analyst
- Advanced: Requires Spatial Analyst or Image Analyst